Audit Log Management
Applying Time Range Filters
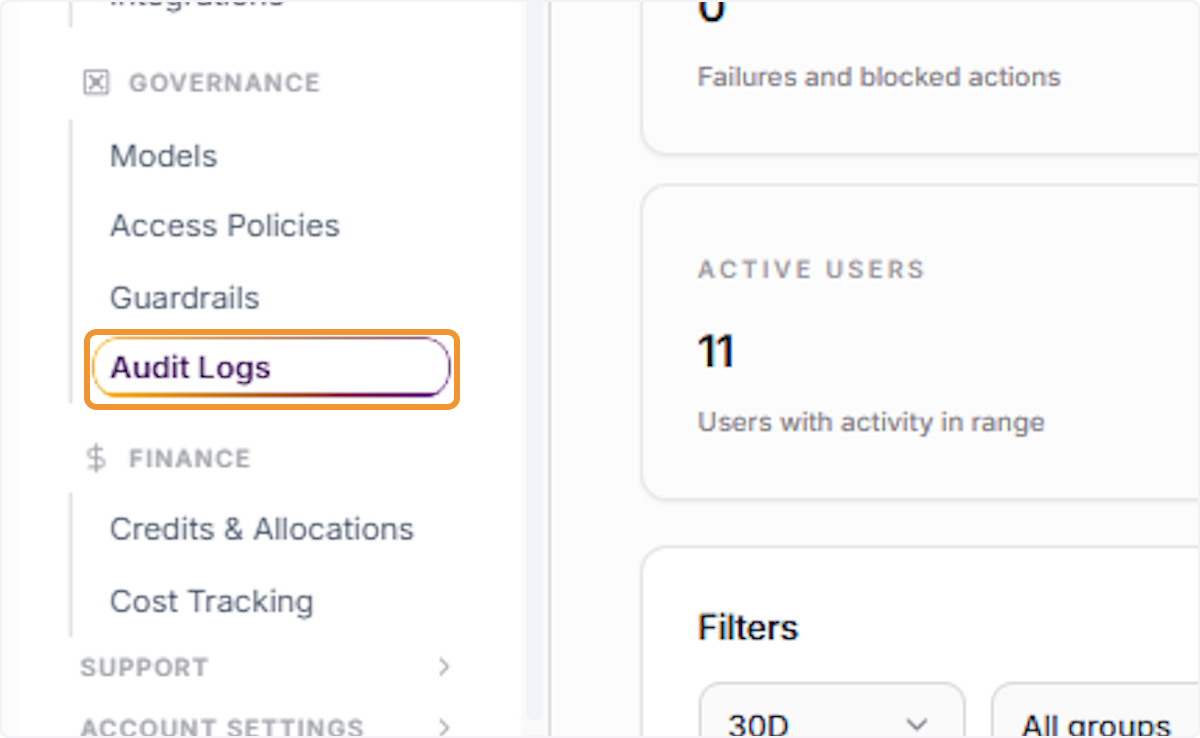
In the left sidebar under the Governance section, click Audit Logs to open the audit dashboard and view a summary of events, conversations, errors, active users, and deleted threads for your organization
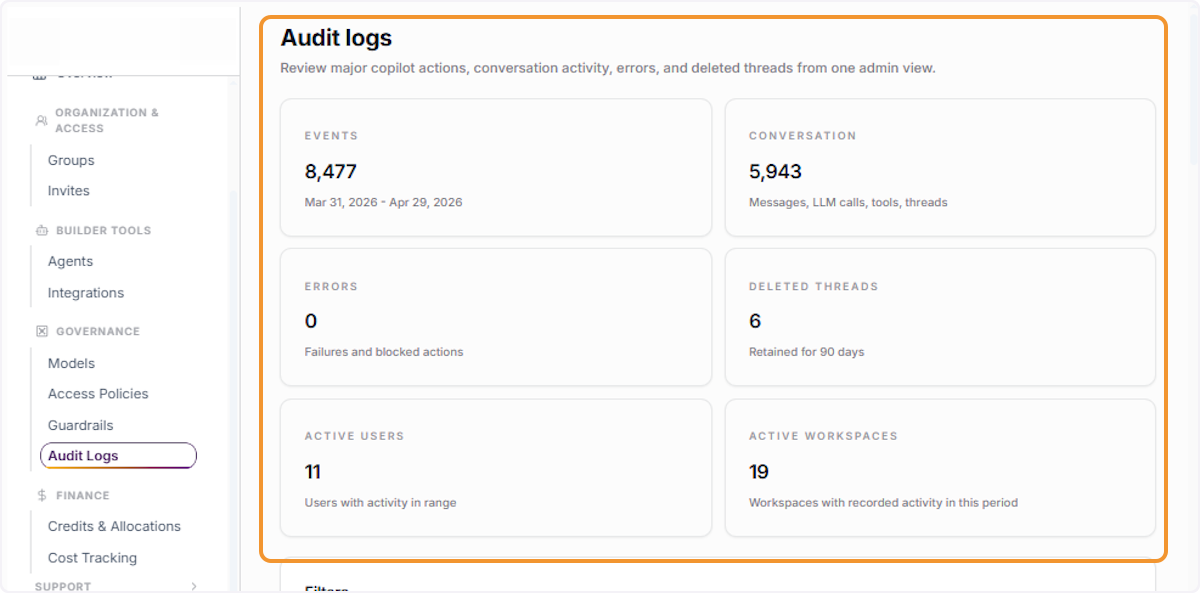
View the 30 Days Audit Log Overview
The Audit Logs dashboard loads with the default 30D (30-day) time range selected, displaying key summary metrics including total Events, Conversations, Errors, Deleted Threads, Active Users, and Active Workspaces
Locate the Filters Panel
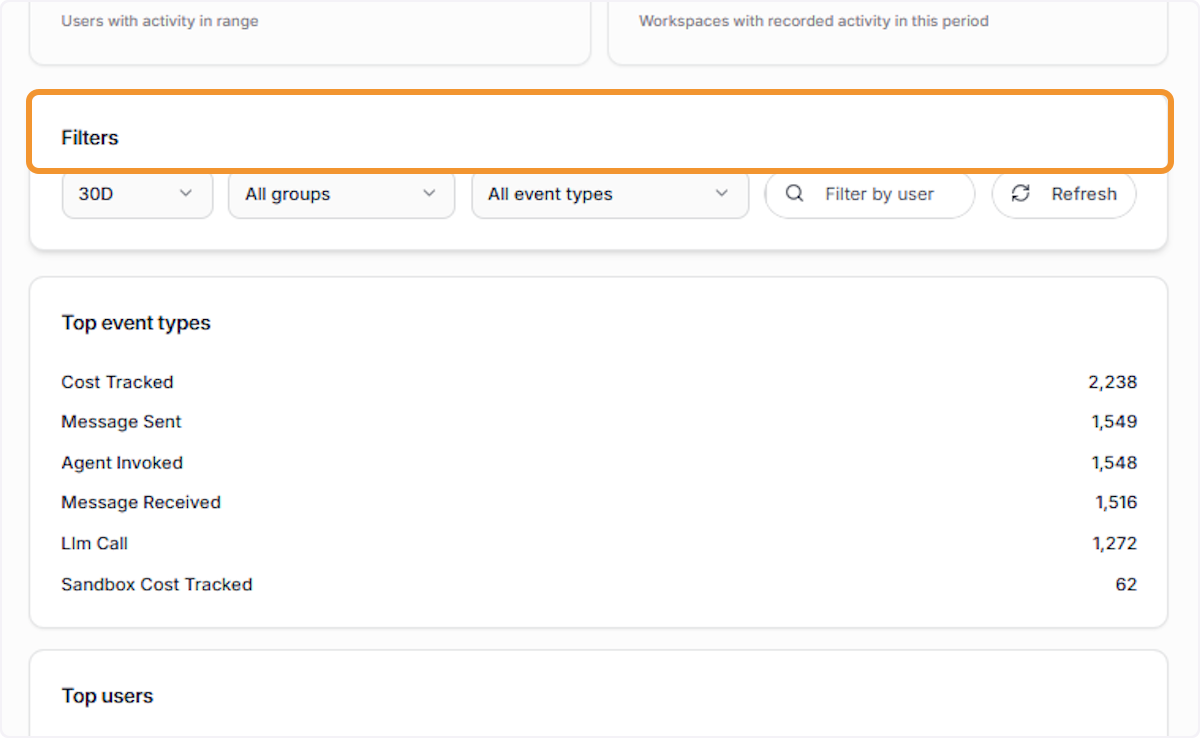
Scroll down to the Filters section to access the available filter controls — including time range, group, event type, and user filters — along with the Top Event Types and Top Users summary panels.
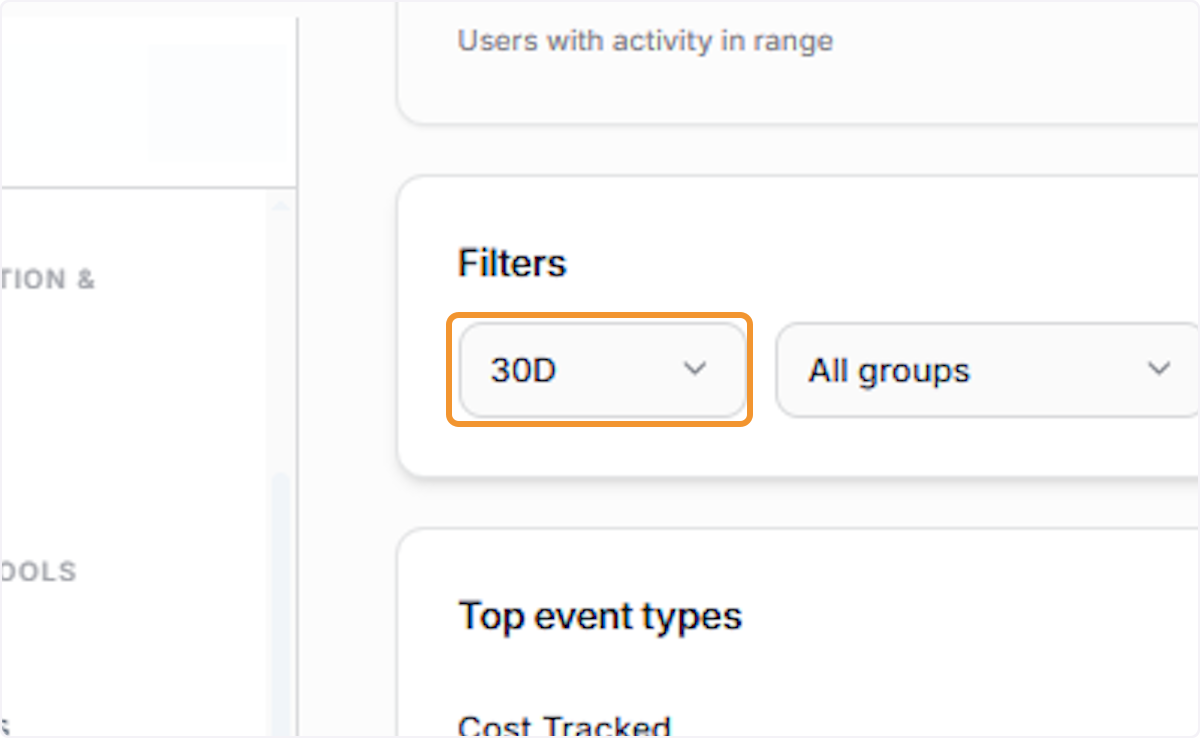
Open the Time Range Filter
Click the 30 Days dropdown in the Filters panel to open the time range selector and view the available preset options for filtering audit log data.
Review Available Time Range Options
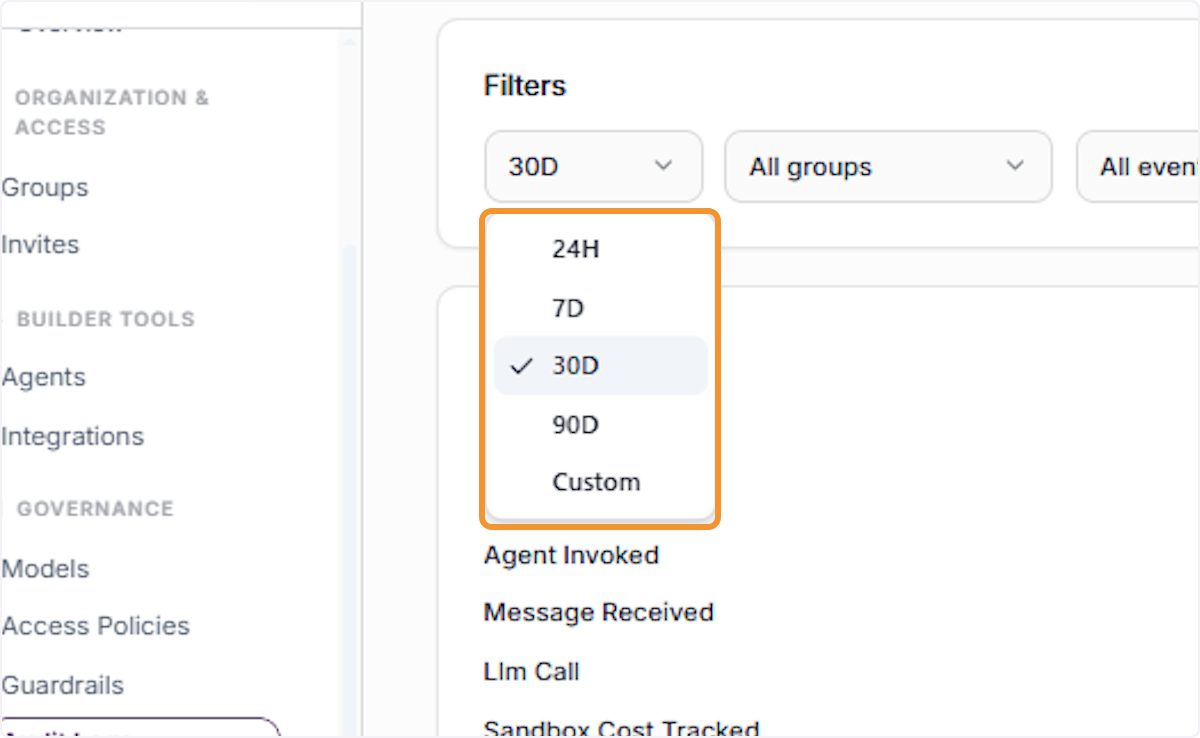
The time range dropdown displays the available preset options: 24H (last 24 hours), 7D (last 7 days), 30D (last 30 days), 90D (last 90 days), and Custom for a manually defined date range. The currently active selection is marked with a checkmark.
Open the Group Filter
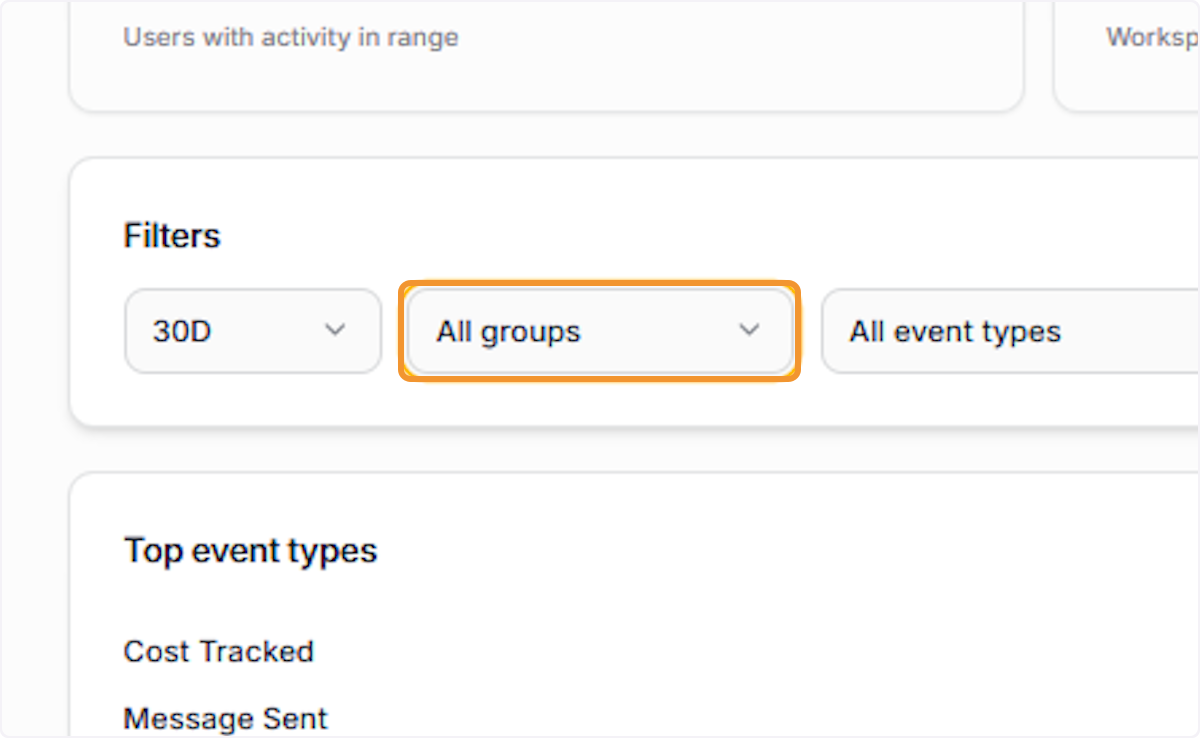
Click the All Groups dropdown in the Filters panel to open the group selector and filter audit log events to show activity from a specific group within your organization.
Review Available Group Categories
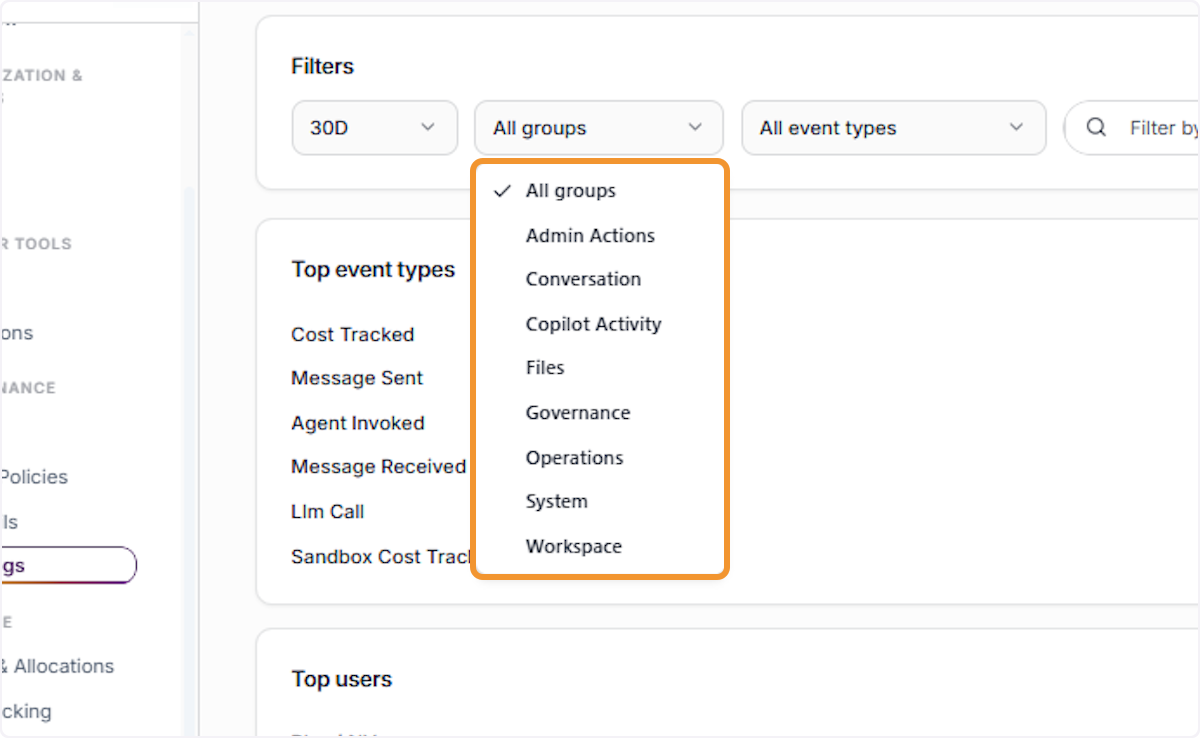
The All Groups dropdown displays the available group filter categories: All Groups, Admin Actions, Conversation, Copilot Activity, Files, Governance, Operations, System, and Workspace. Select a category to narrow the audit log view.
Select Admin Actions Group Filter
Select Admin Actions from the group dropdown to filter the audit log to display only administrative actions performed within the account during the selected time range.
Open the Event Type Filter
With the Admin Actions group filter active, click the All Event Types dropdown to view.
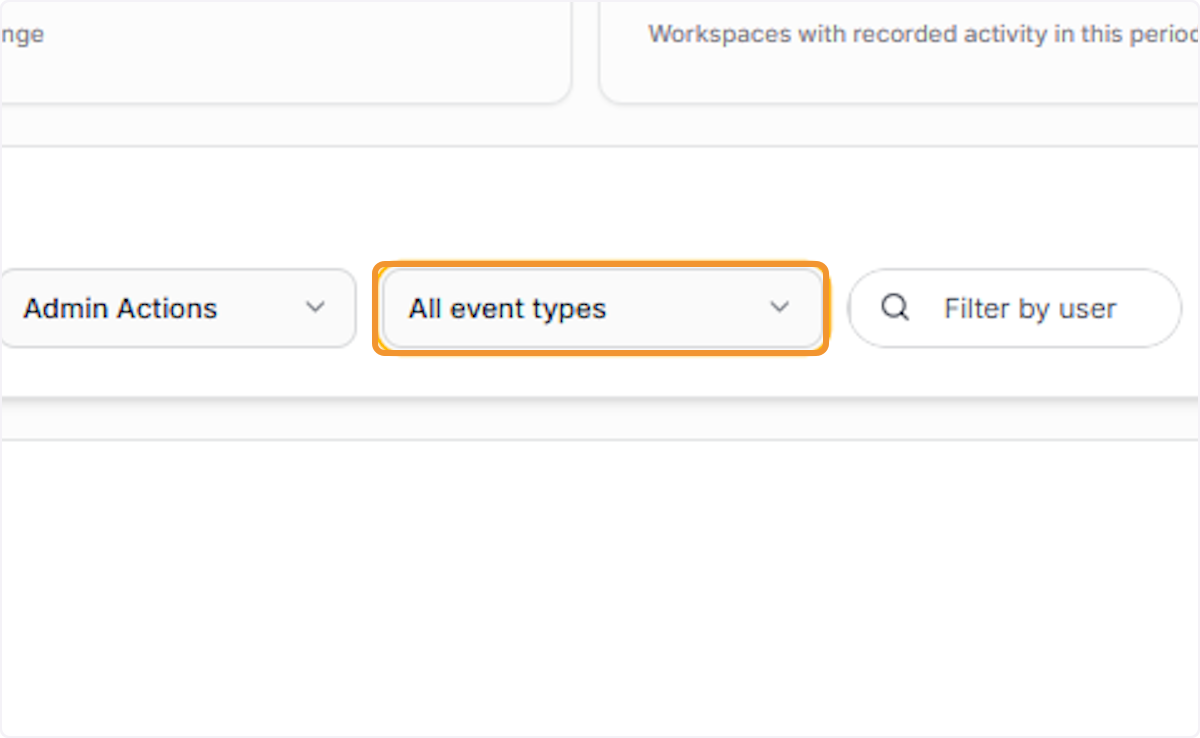
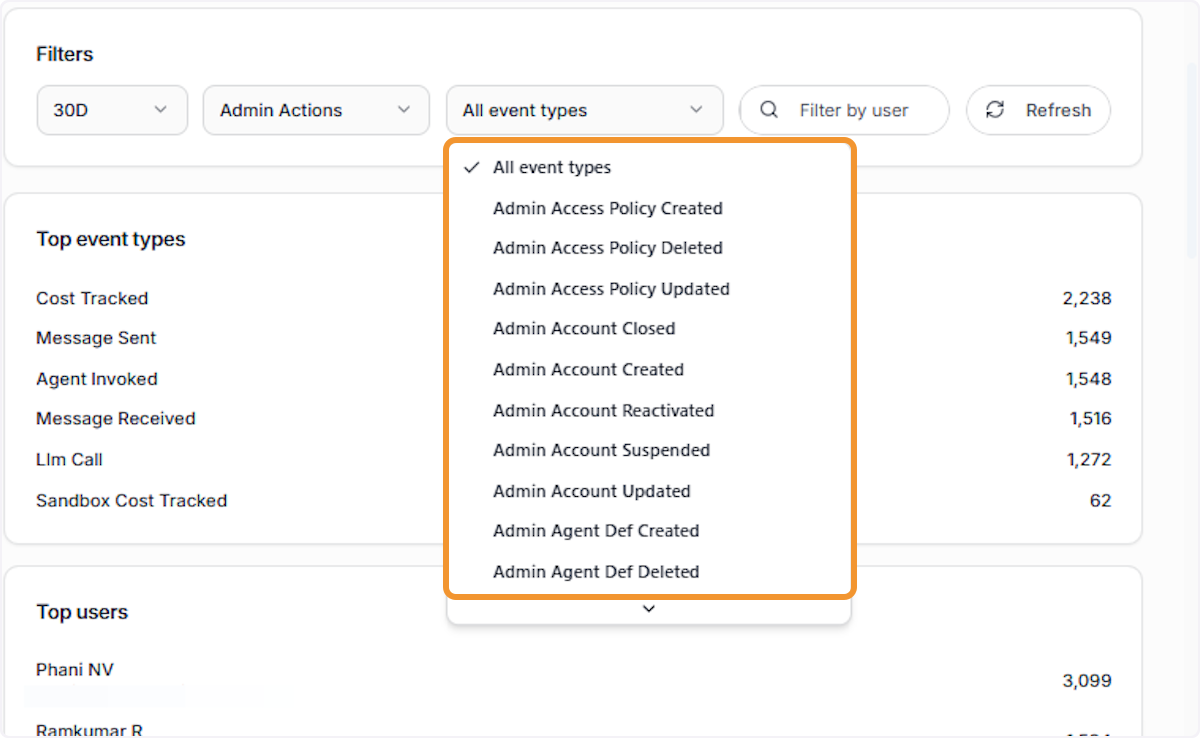
Click on All event types…
Select from the full list of specific admin event types available for filtering, such as Admin Access Policy Created, Admin Account Closed, Admin Agent Def Created, and others.
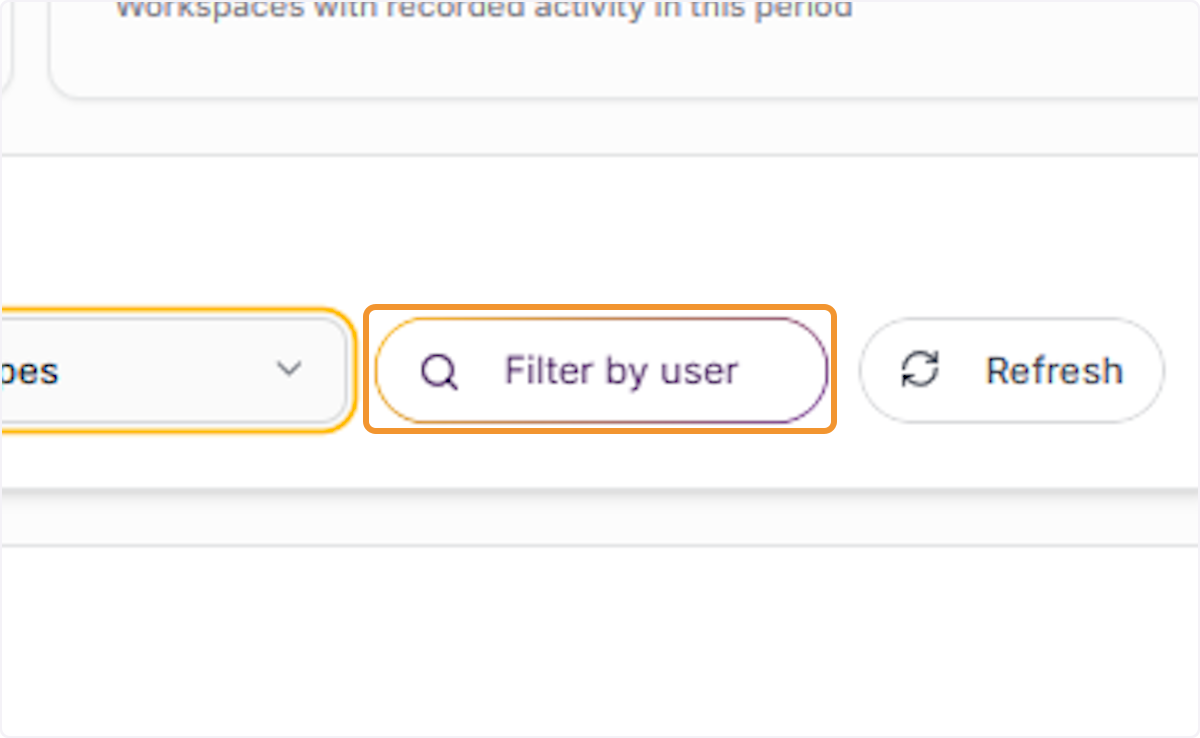
Click Filter by User
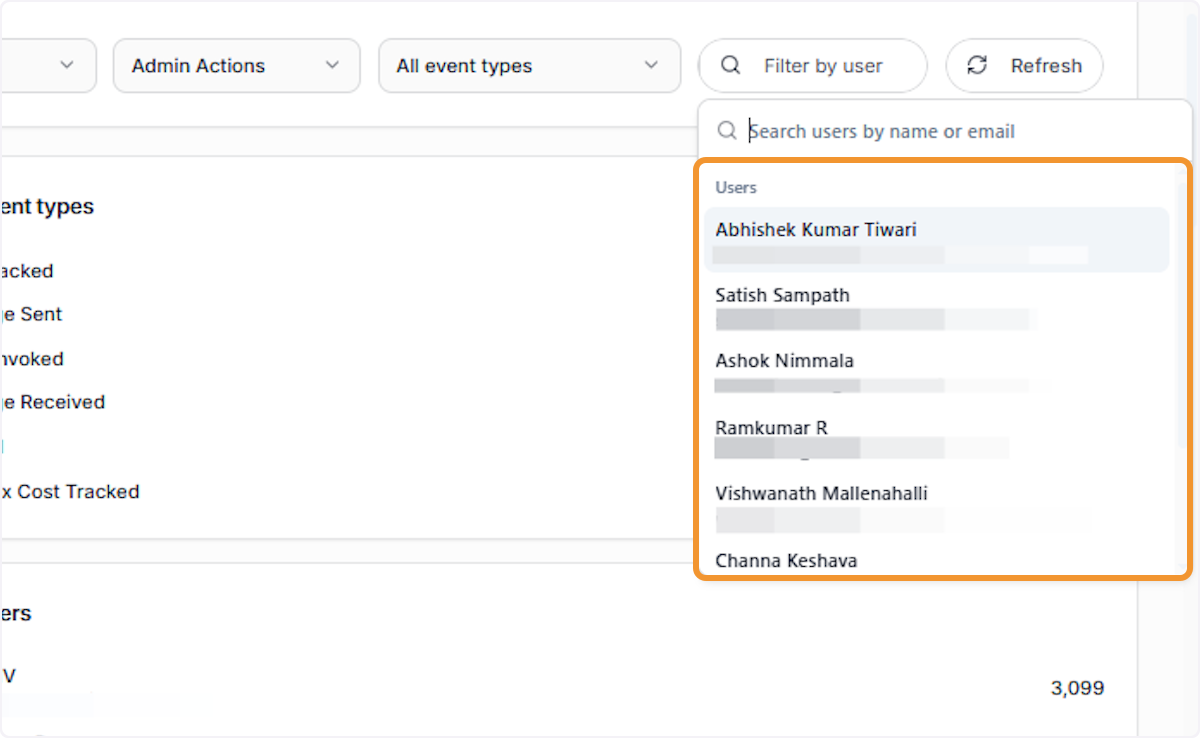
Click the Filter by User search field in the Filters toolbar to open the user search panel, which allows you to narrow audit log results to events associated with a specific account member.
Search and Select a User
Type a name or email address in the search field to find a specific user. Click on the desired user such as xyz from the search results to apply the user filter to the audit log view.
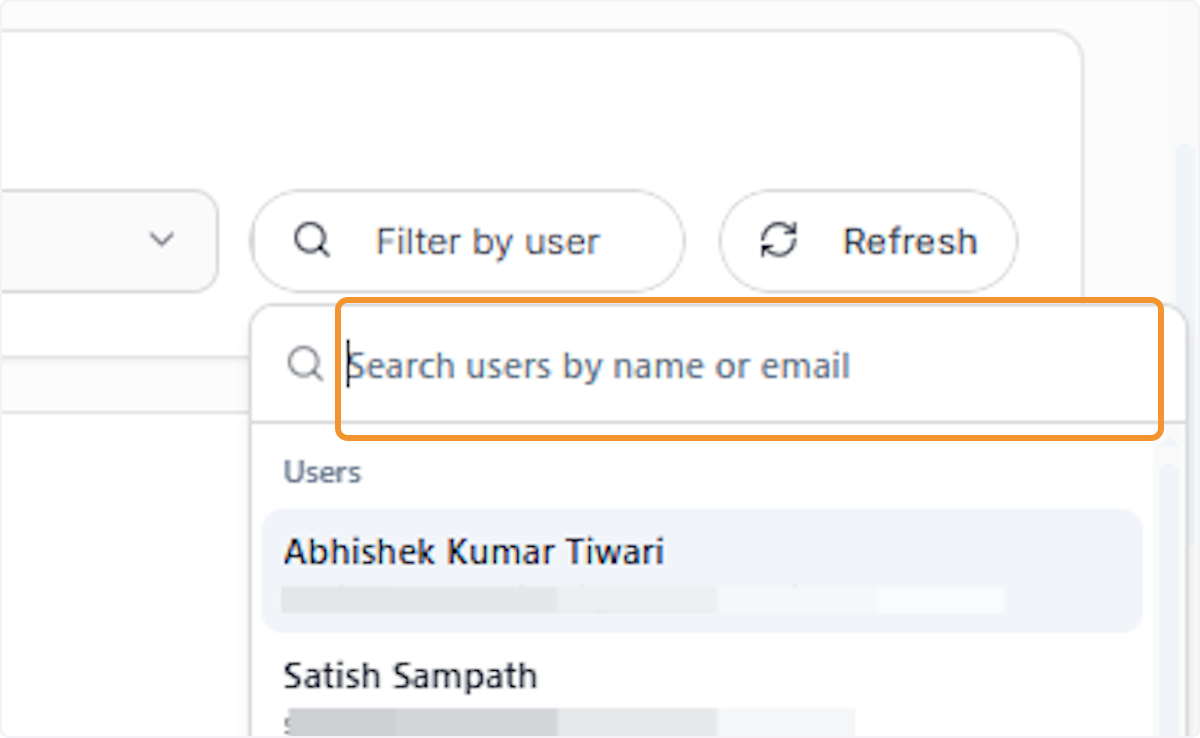
Review User Suggestions List
The user search panel displays a list of suggested active account members, including their name and email address. Scroll through the list or continue typing to locate and select the specific user you want to filter by.
Review Top Event Types Panel
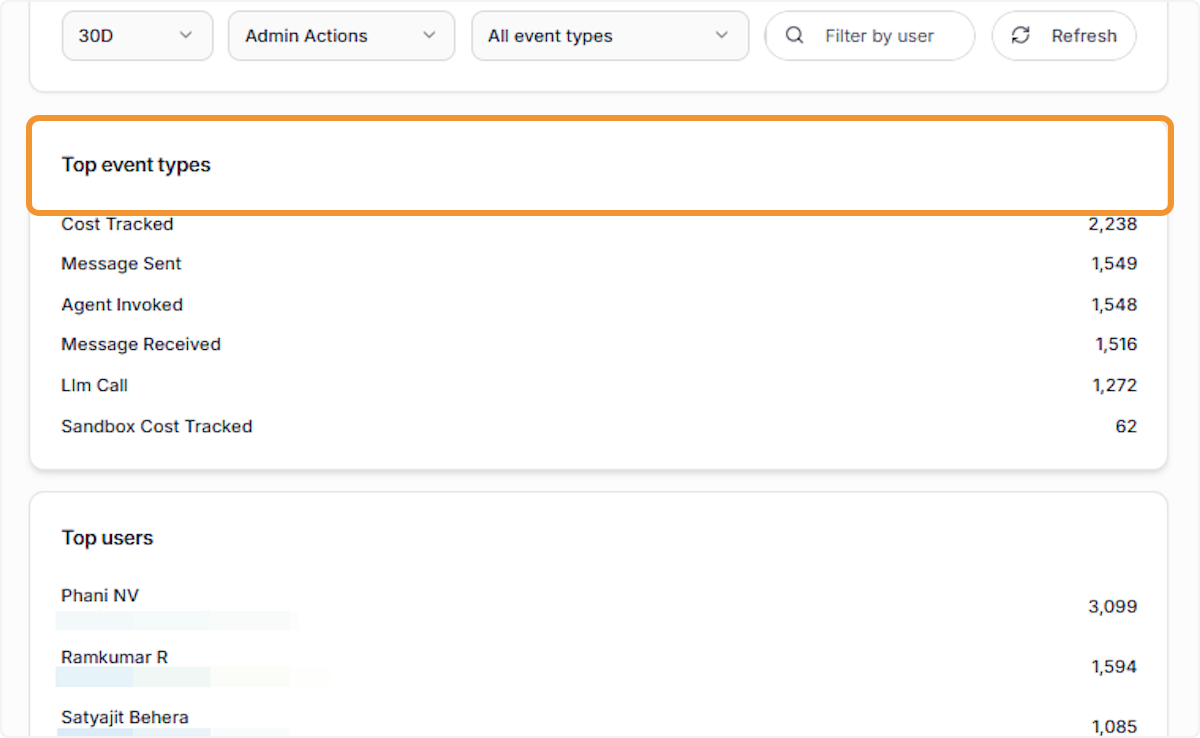
Scroll to the Top Event Types section to see a ranked summary of the most frequent event types recorded in the selected time period. The top events include Cost Tracked (2,238), Message Sent (1,549), Agent Invoked (1,548), Message Received (1,516), Llm Call (1,272), and Sandbox Cost Tracked (62).
A. Click on Cost Tracked…
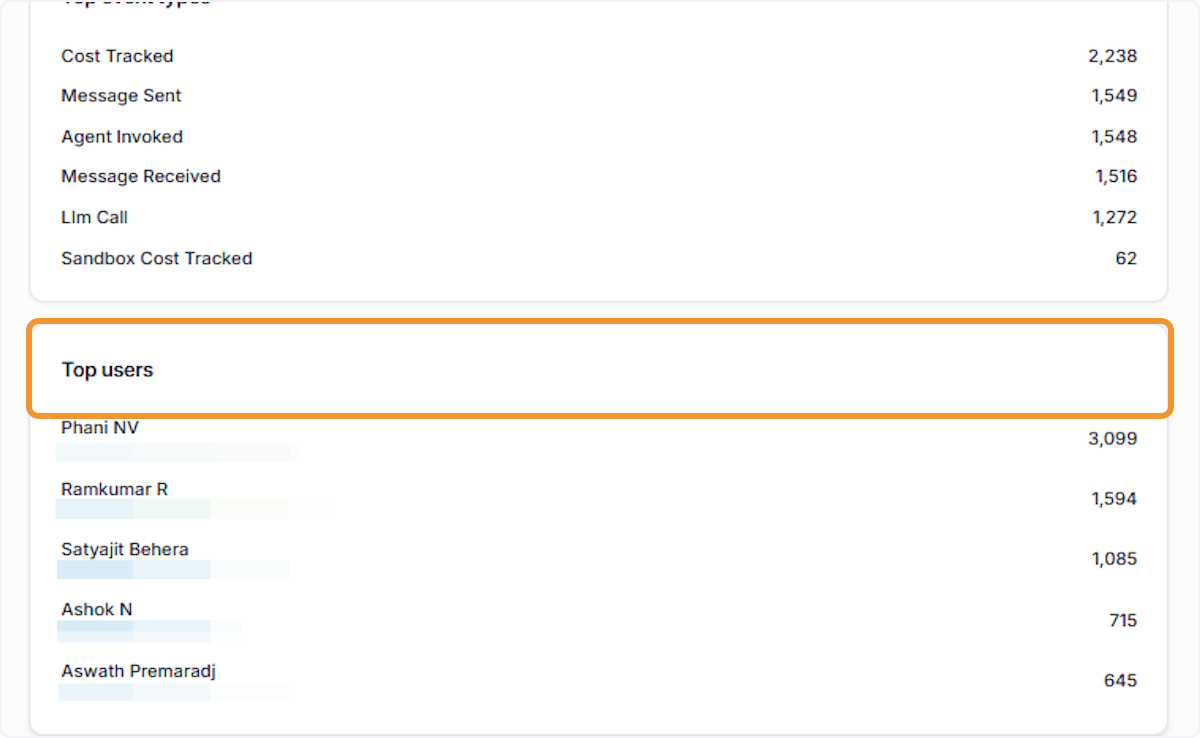
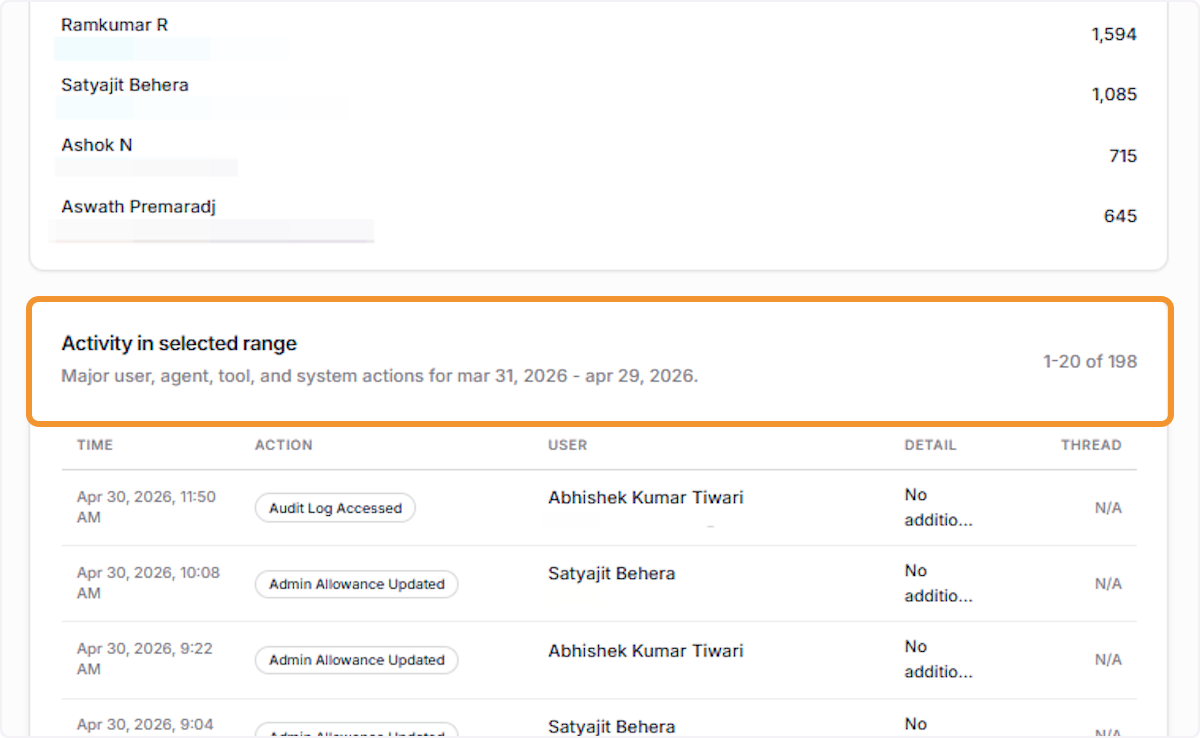
Click on Top users
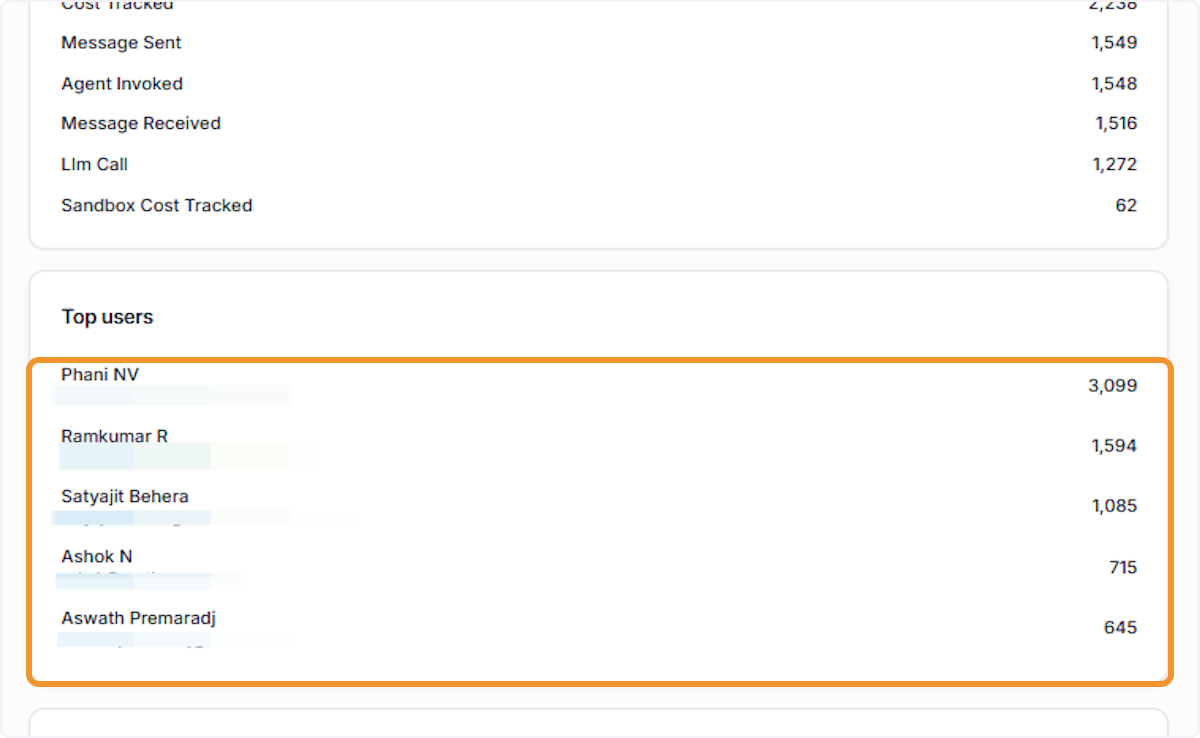
Check top users
Click on Activity in selected range…
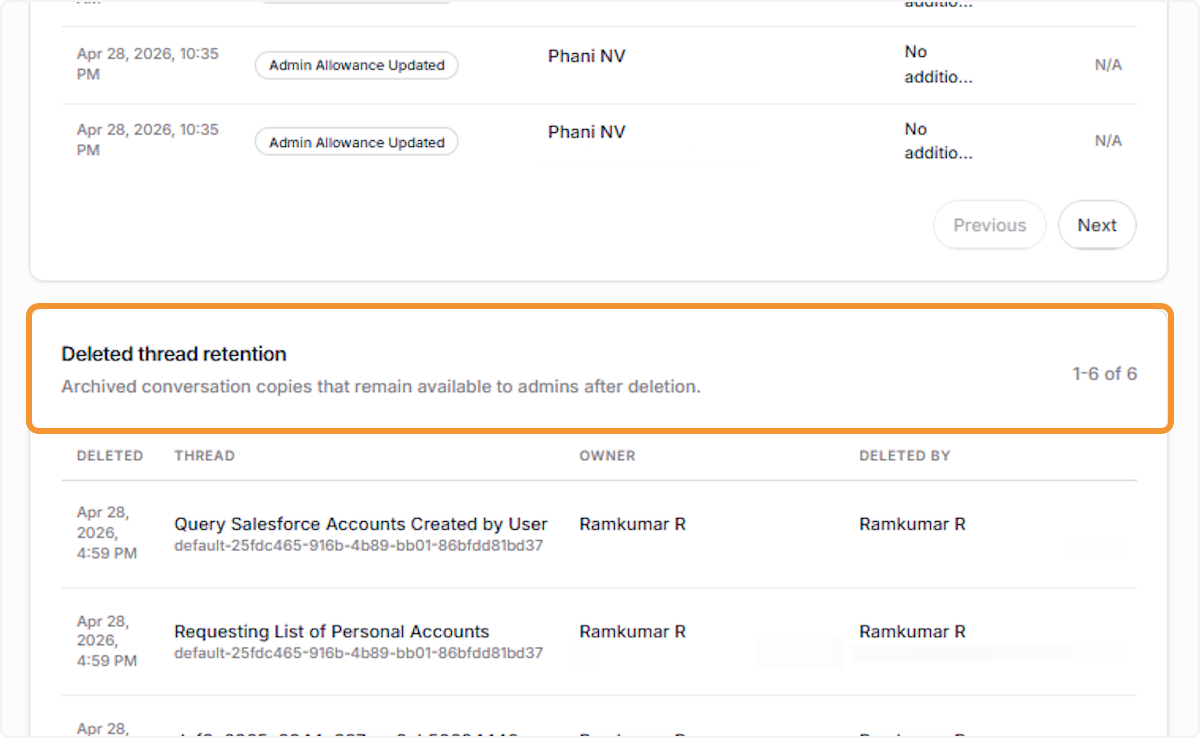
Click on Deleted thread retention…