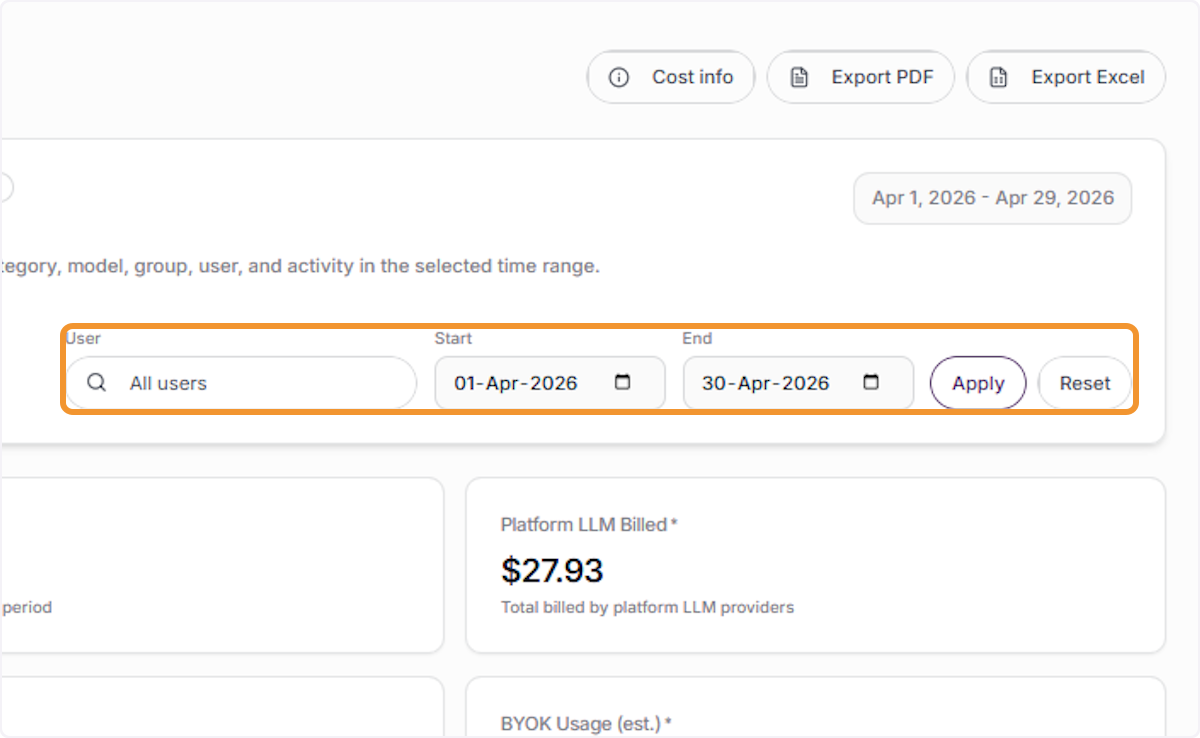
Cost Tracking Management
Exploring the Cost Tracking Dashboard
In the left sidebar under the Finance section, click Cost Tracking to open the cost dashboard and view your organization’s credit usage and spend data.
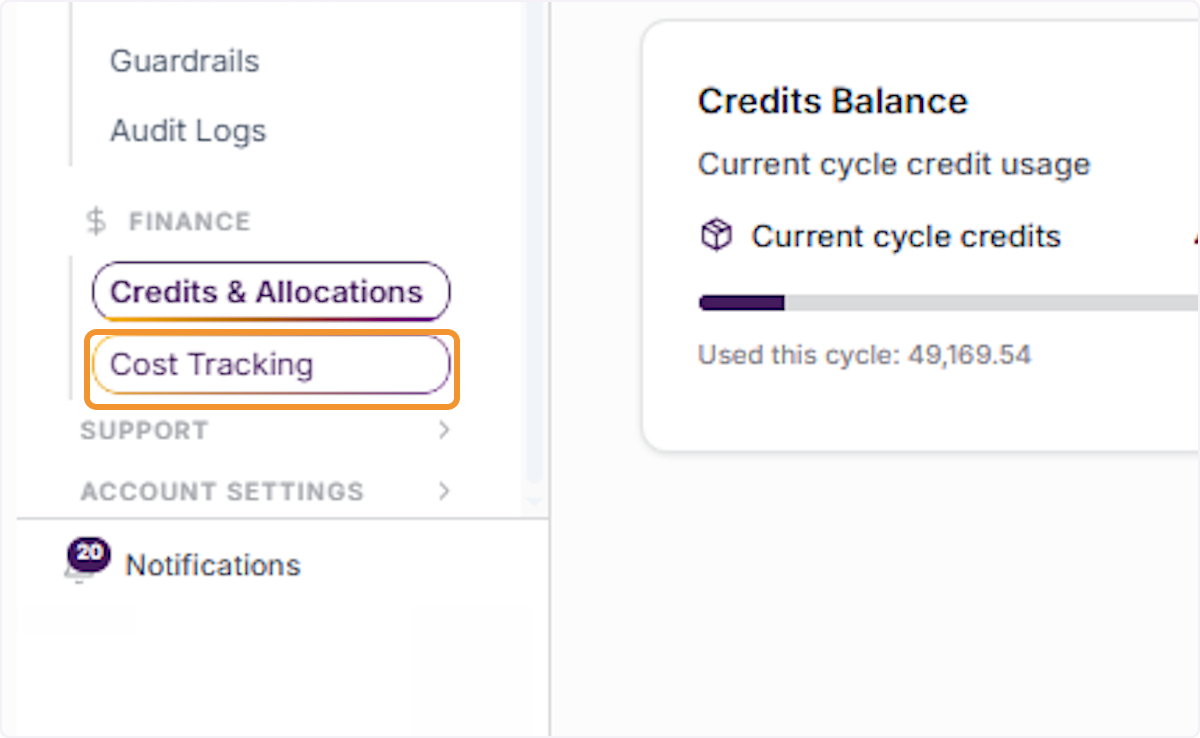
View Cost Tracking Dashboard
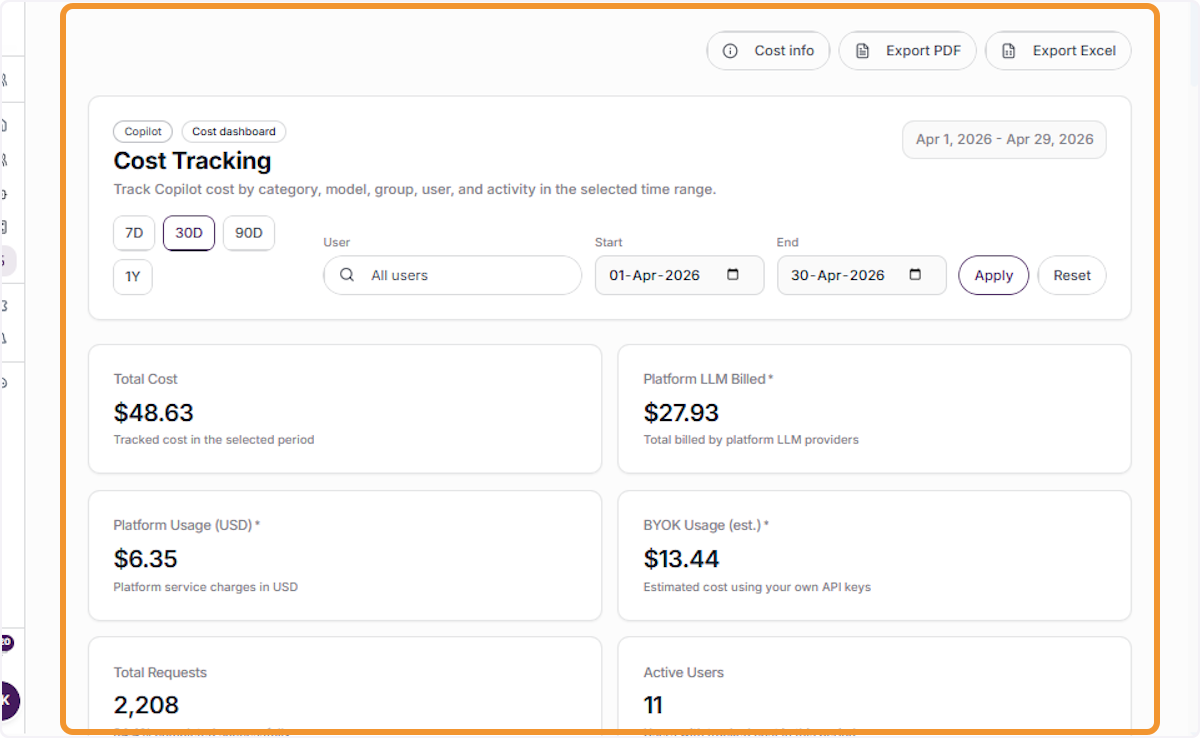
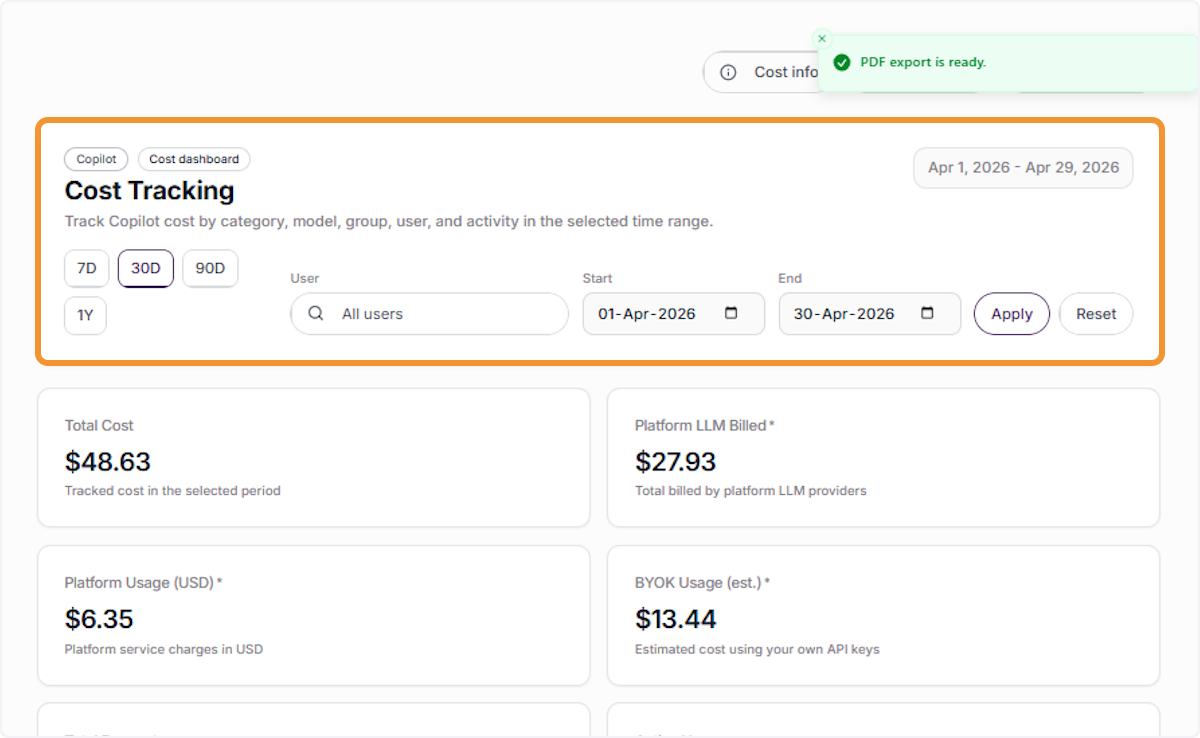
Review the Cost Tracking overview, which displays key metrics including Total Cost, Platform LLM Billed, Platform Usage (USD), BYOK Usage Estimate, Total Requests, and Active Users for the selected time period.
Review Cost Composition
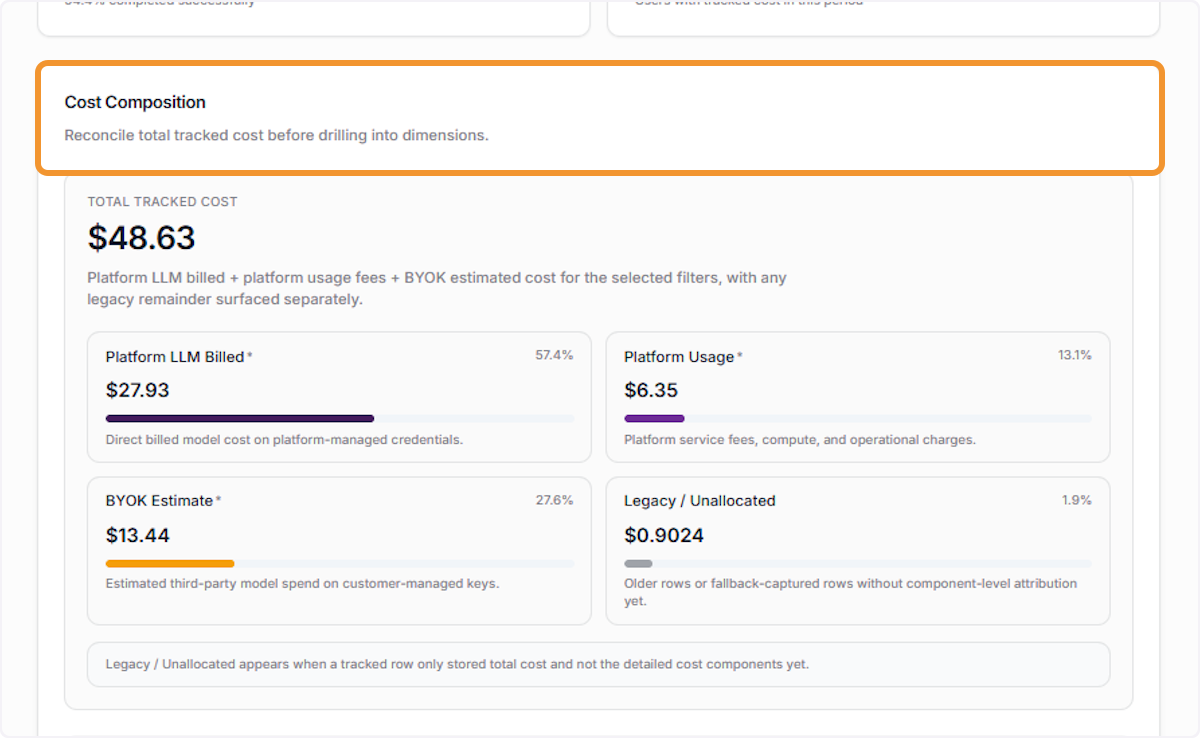
Scroll to the Cost Composition section to view a full breakdown of your total tracked cost of $48.63, split across Platform LLM Billing, Platform Usage, BYOK Estimates, and Legacy/Unallocated categories.
Analyzing Cost Breakdown Sections
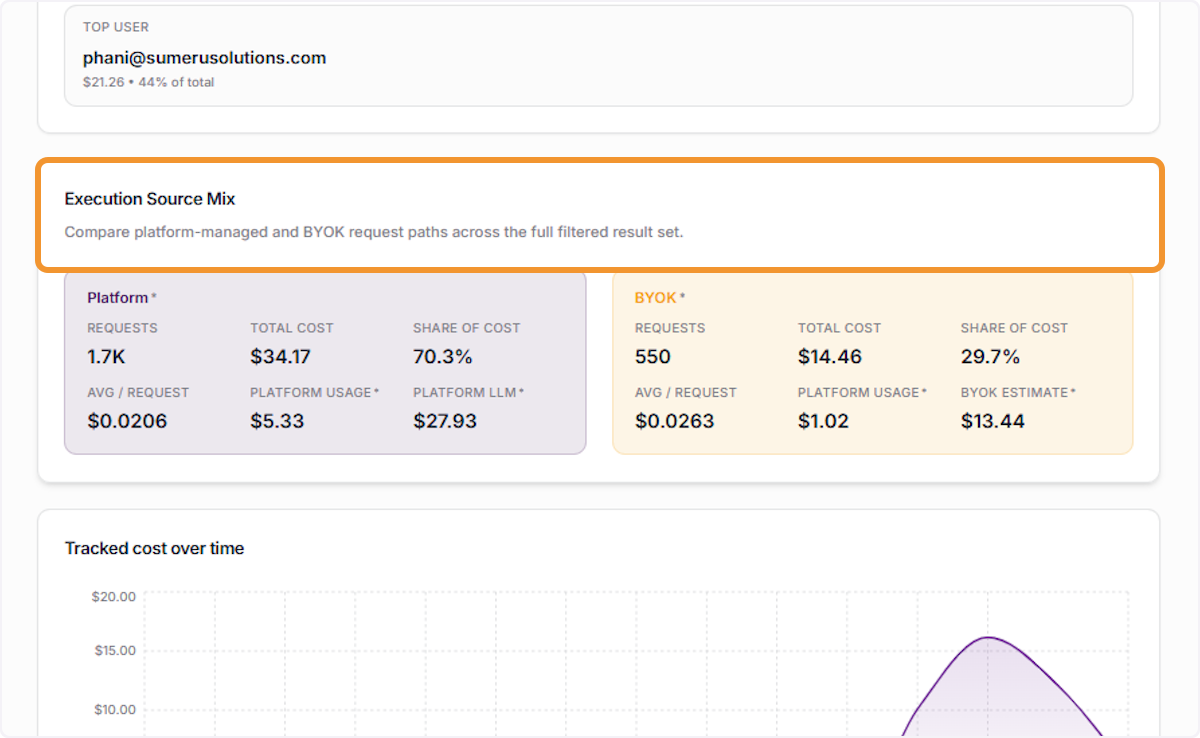
Review Execution Source Mix
Scroll to the Execution Source Mix section to compare costs and request volumes between Platform-managed and BYOK (Bring Your Own Key) execution paths, along with tracked cost trends over time.
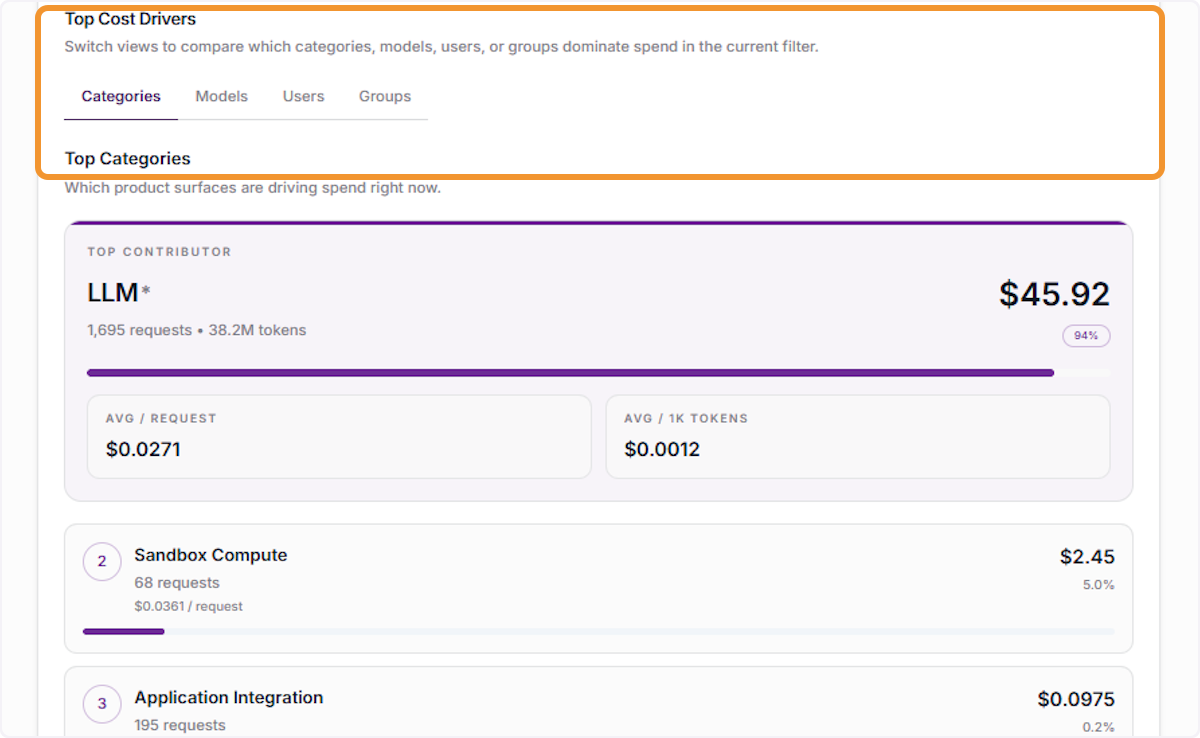
Review Top Cost Drivers
Scroll to the Top Cost Drivers section to identify which categories, models, users, or groups are contributing the most to overall spend during the selected time period.
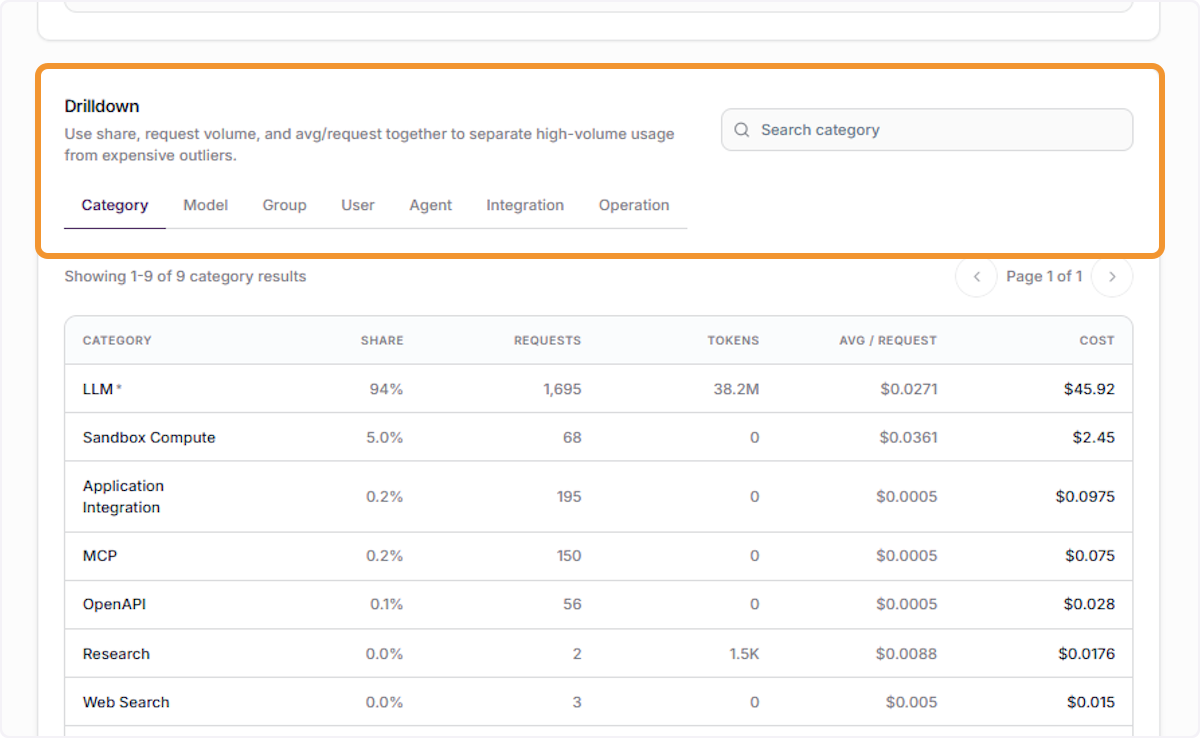
Explore the Drilldown Table
Scroll to the Drilldown section to view a detailed breakdown of requests, tokens, average cost per request, and total cost — filterable by Category, Model, Group, User, Agent, Integration, or Operation.
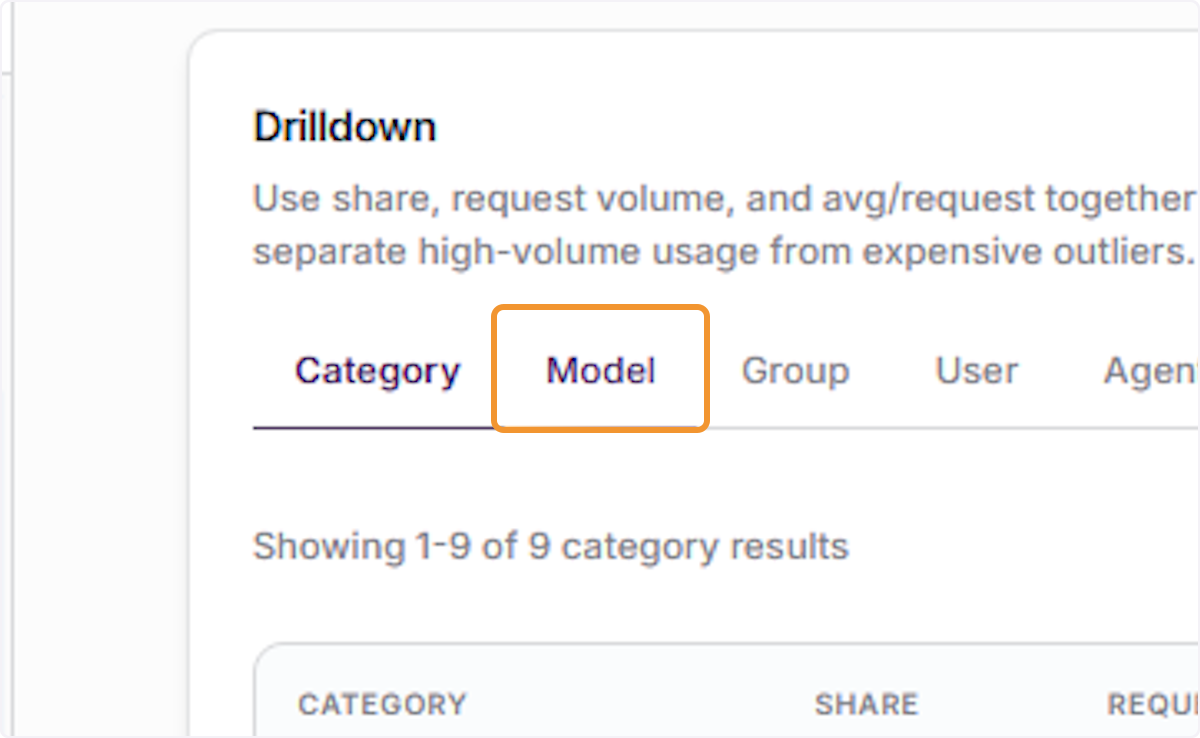
Filter Drilldown by Model
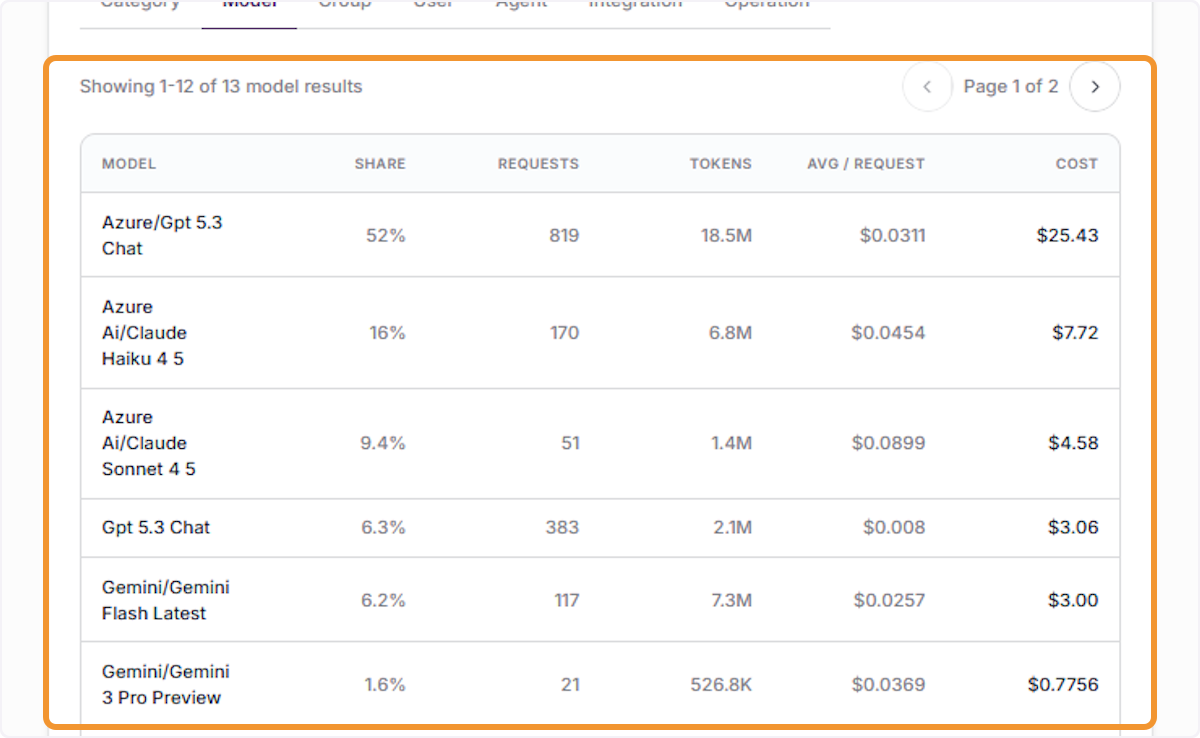
In the Drilldown section, click the Model tab to switch the breakdown view and see cost share, request volume, token usage, average cost per request, and total cost grouped by each AI model used.
Review Model-Level Results
Review the paginated model results table showing all 13 models in use. Identify high-cost models such as Azure/GPT and Claude variants to understand which models are driving the most spend.
Filter Drilldown by Group
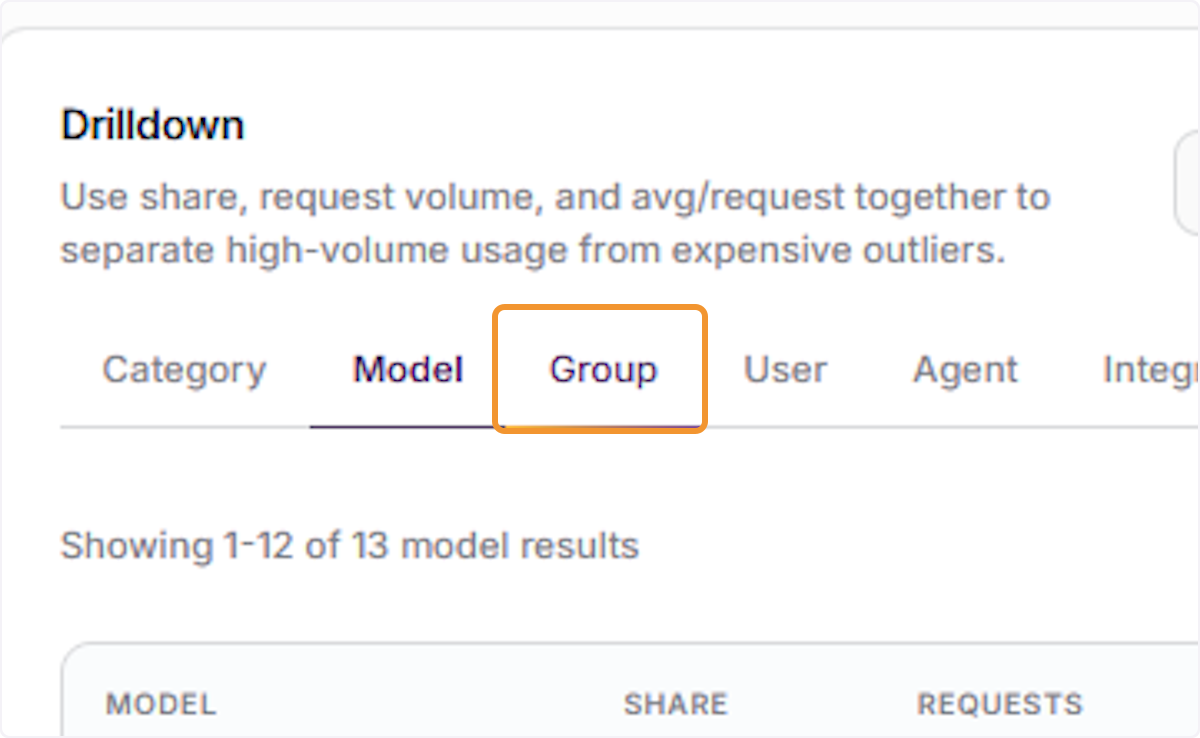
Click the Group tab in the Drilldown section to view cost share, requests, tokens, average cost per request, and total spend broken down by each user group in your organization.
Review Group-Level Results
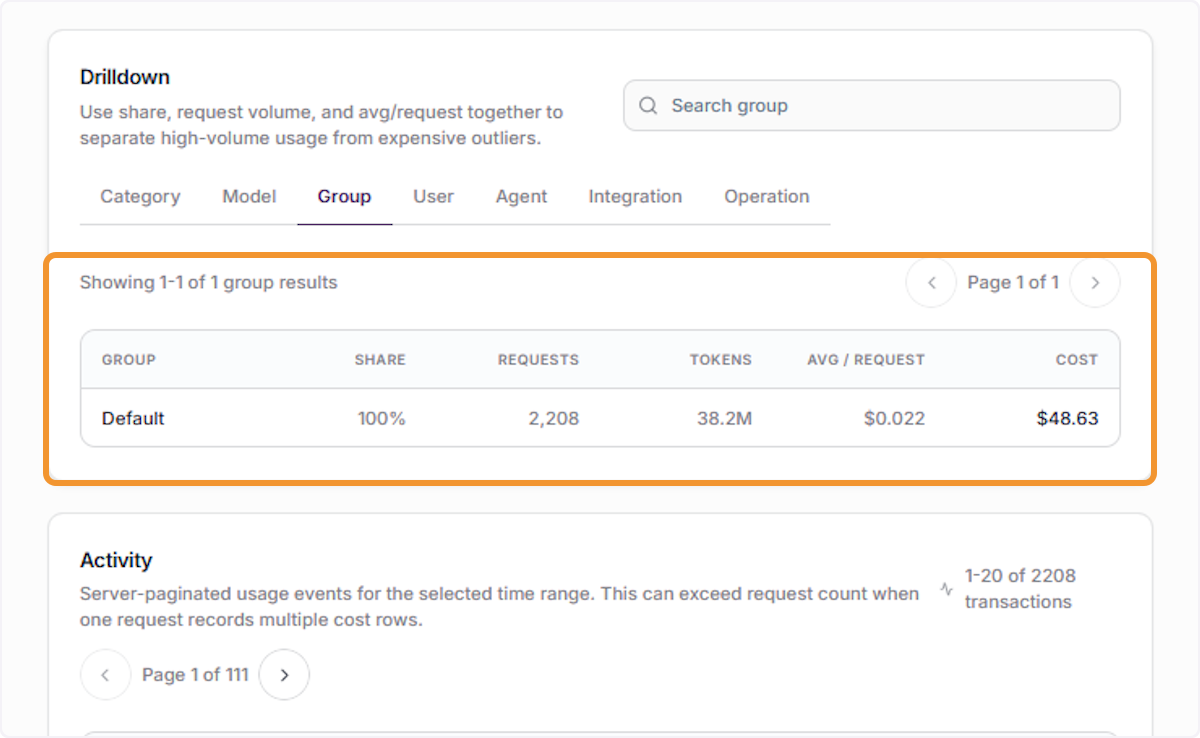
Review the group results table to see cost attribution across all groups. The Default group is shown with its full share of requests, tokens, and total cost for the selected period.
Filter Drilldown by User
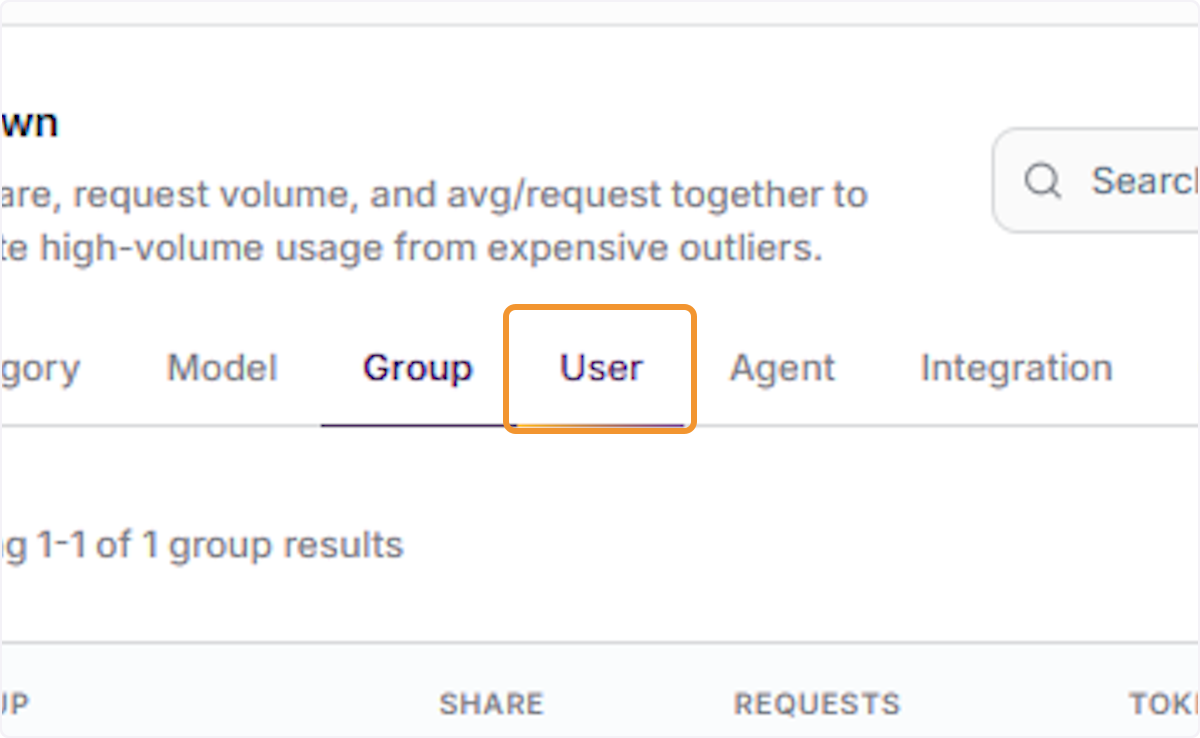
Click the User tab in the Drilldown section to view cost share, request volume, tokens, and total spend broken down by each individual user across your organization.
Review User-Level Results
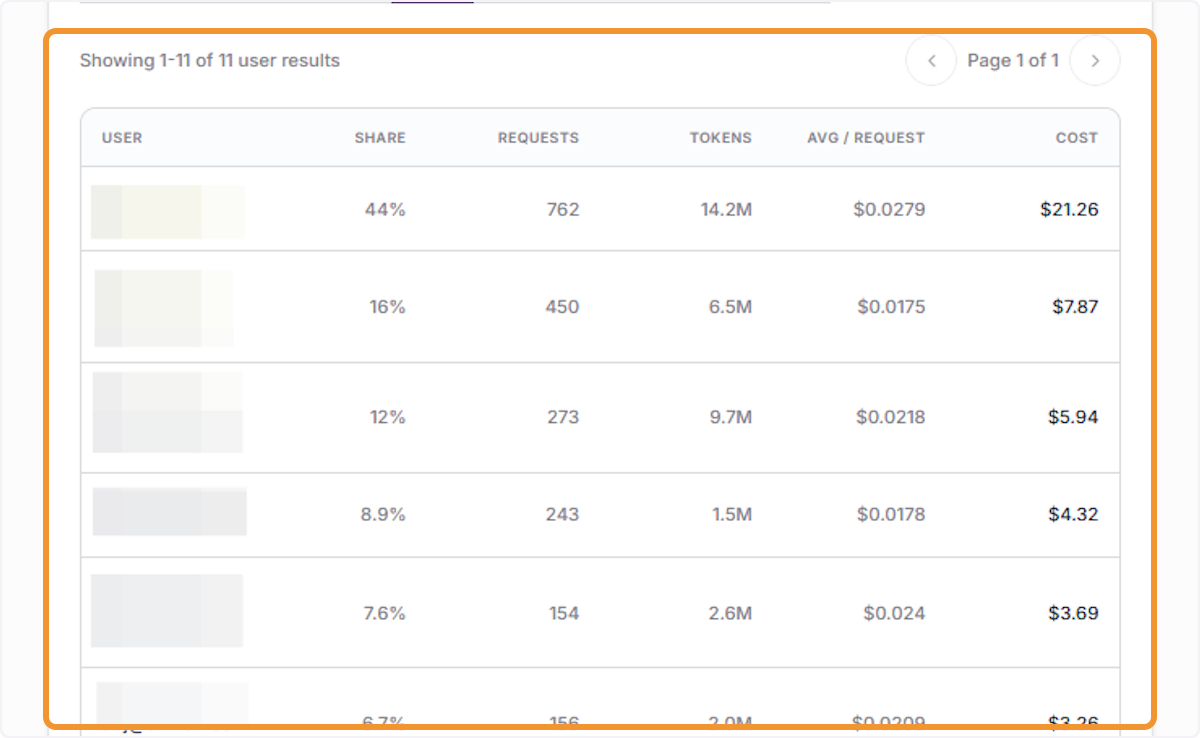
Review the user results table showing all 11 active users, their percentage share of total cost, number of requests, tokens consumed, average cost per request, and individual total spend.
Review Agent-Level Results
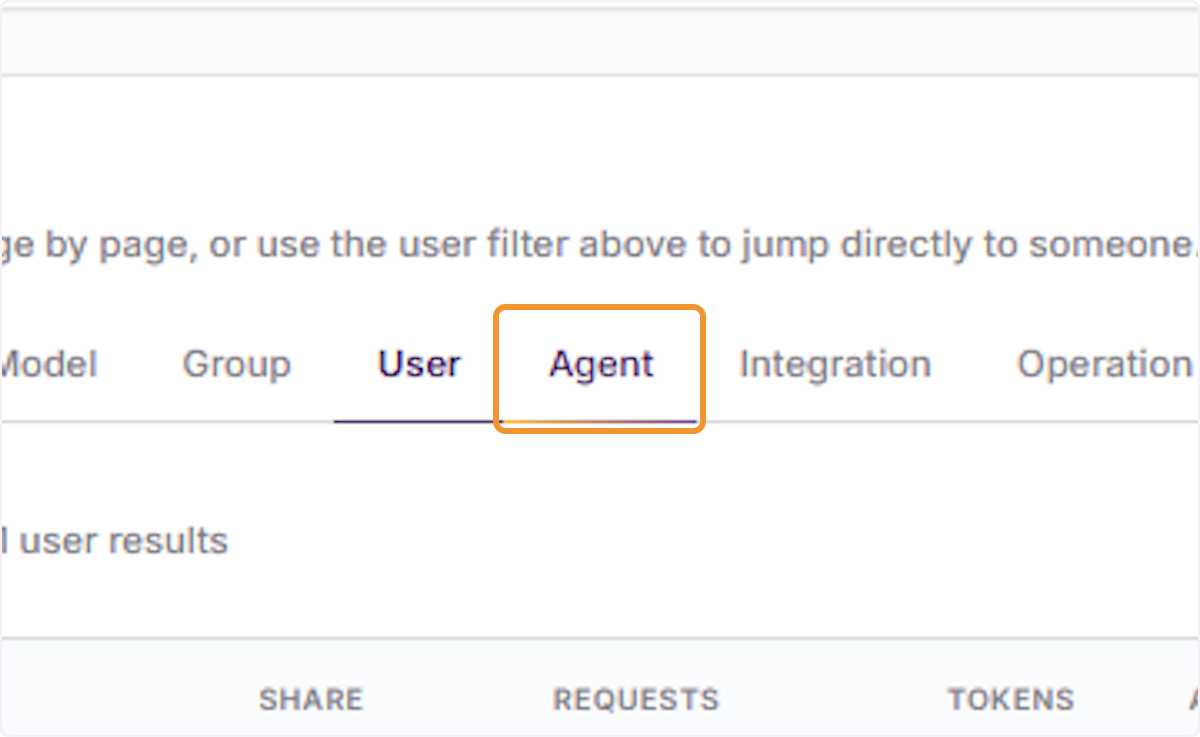
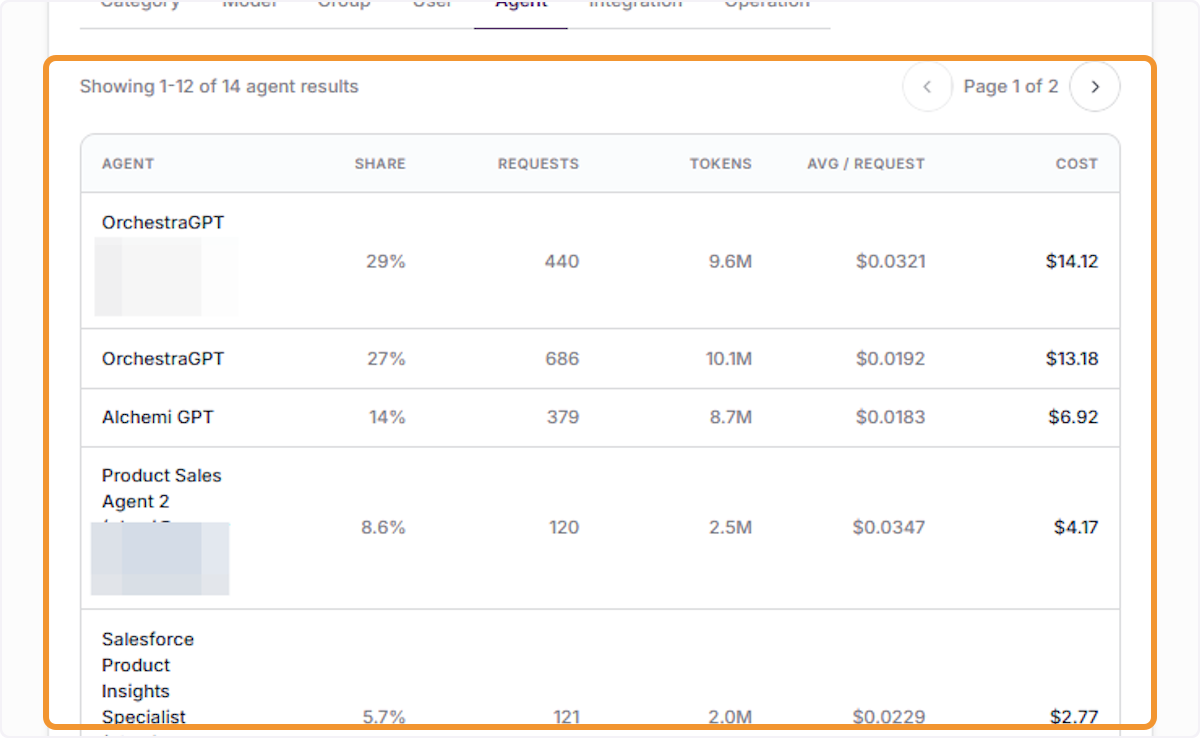
Review the agent results table showing all 14 agents. Identify top cost contributors such as OrchestraGPT and Alchemi GPT by comparing their share of requests, tokens, and total spend.
Filter Drilldown by Integration
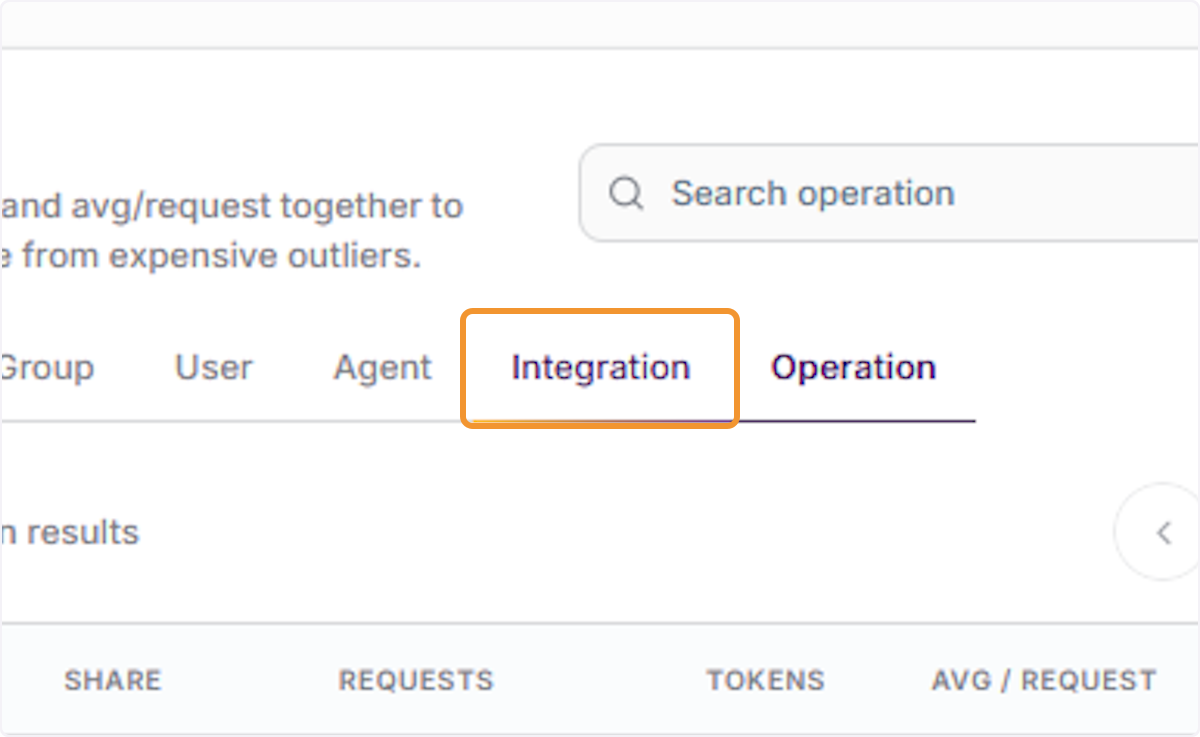
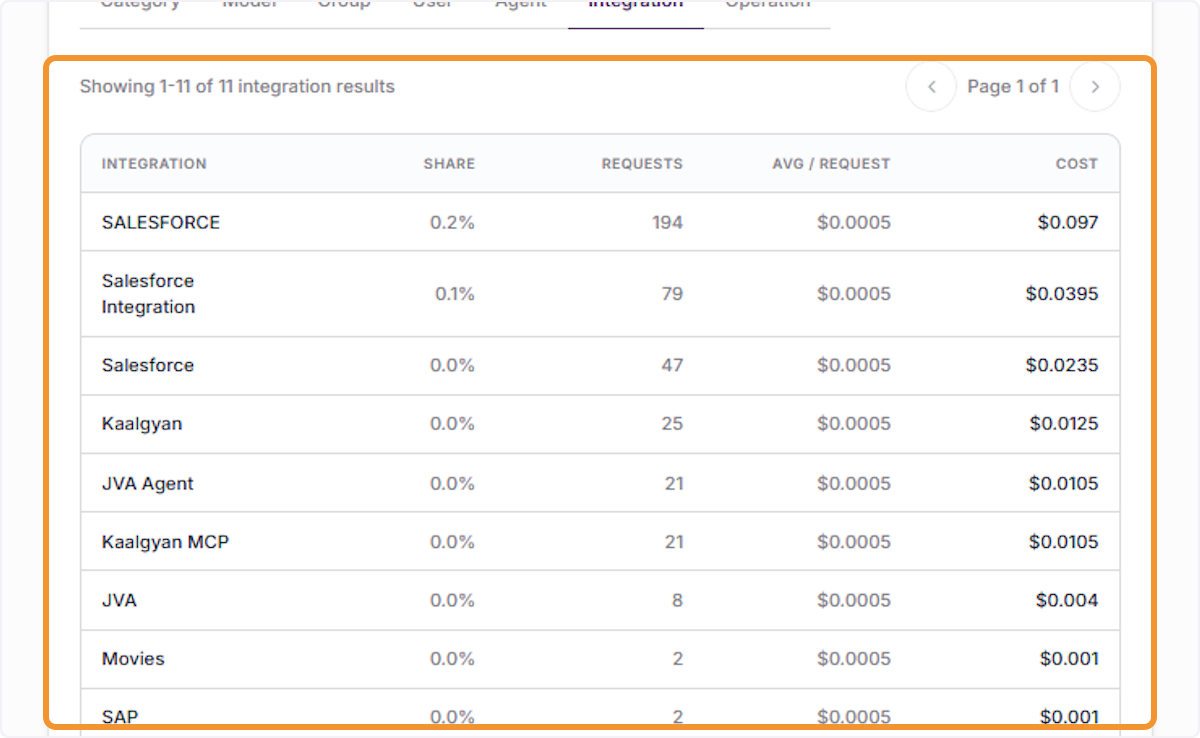
Click the Integration tab in the Drilldown section to view cost breakdown by third-party integrations connected to your Copilot, such as Salesforce, Kaalgyan, JVA Agent, and others.
Filter Drilldown by Integration
Click the Integration tab in the Drilldown section to view cost breakdown by third-party integrations connected to your Copilot, such as Salesforce, Kaalgyan, JVA Agent, and others.
Review Integration-Level Results
Review the integration results table showing all 11 integrations. Compare each integration’s share of total requests, average cost per request, and total cost to identify the highest-usage connections.
Filter Drilldown by Operation
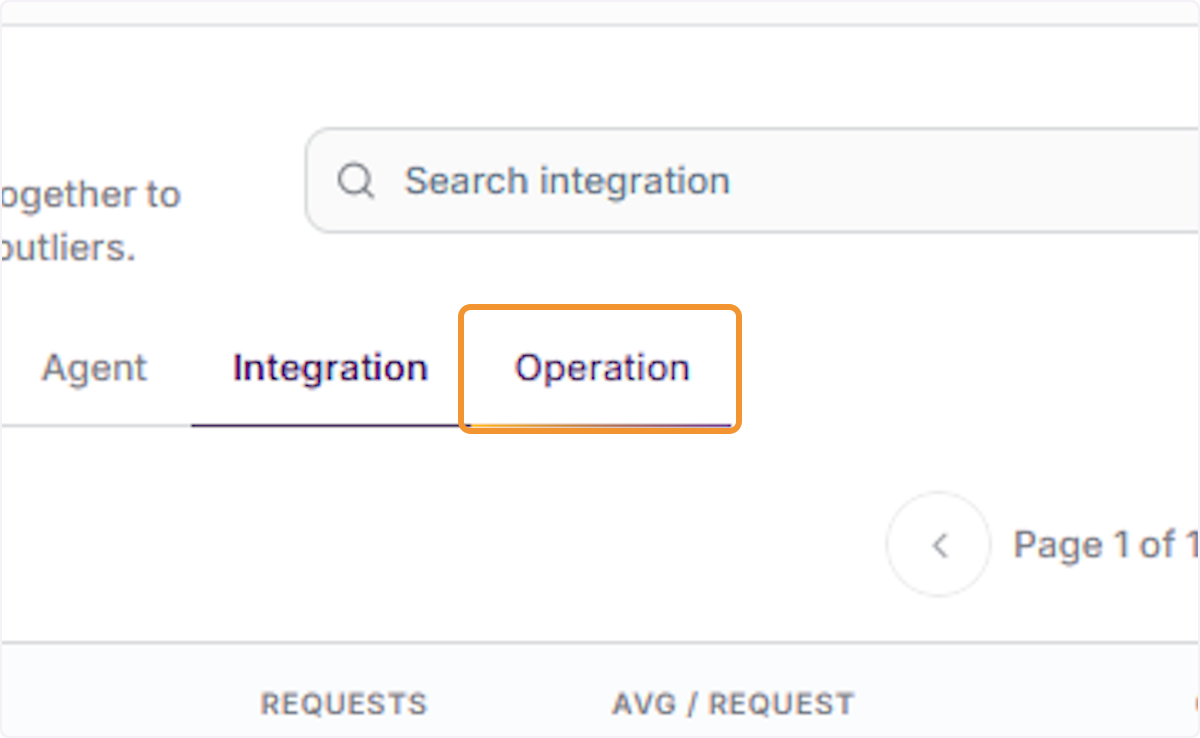
Click the Operation tab in the Drilldown section to view cost broken down by individual operation types, such as LLM calls, Sandbox Compute, Conversation Summary, and Salesforce queries.
Review Operation-Level Results
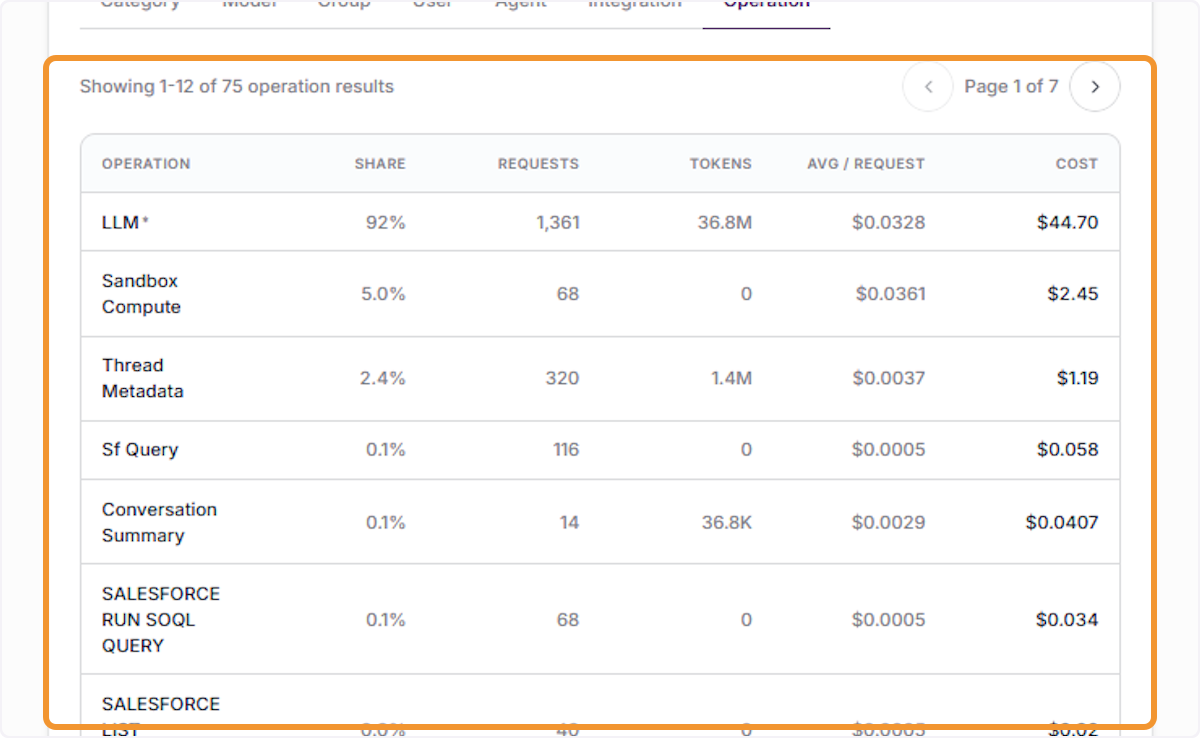
Review the operation results table showing all 75 operations across 7 pages. The top operations by cost are LLM, Sandbox Compute, and Thread Metadata — use this view to pinpoint specific high-volume operations.
Reviewing Activity & Pricing
Review the Activity Log
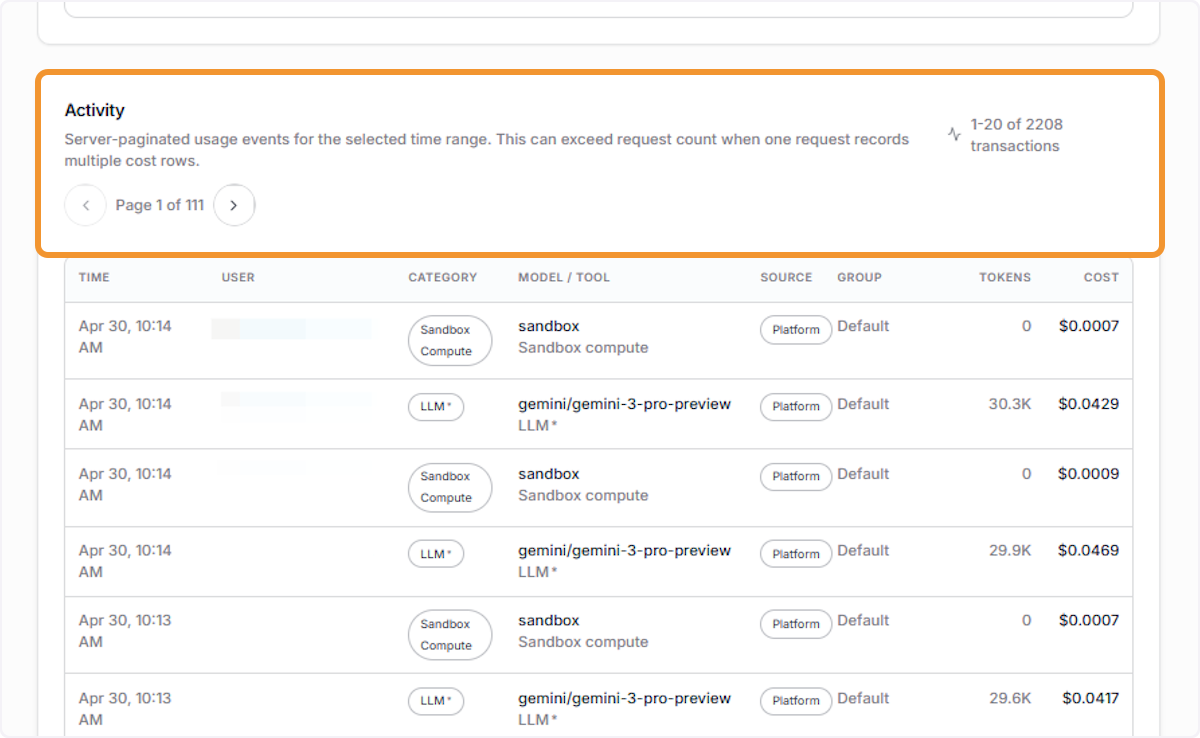
Scroll to the Activity section to view a paginated real-time log of all usage events, including time, user, category, model, source, group, tokens consumed, and cost per transaction.
Open the Cost Info Panel
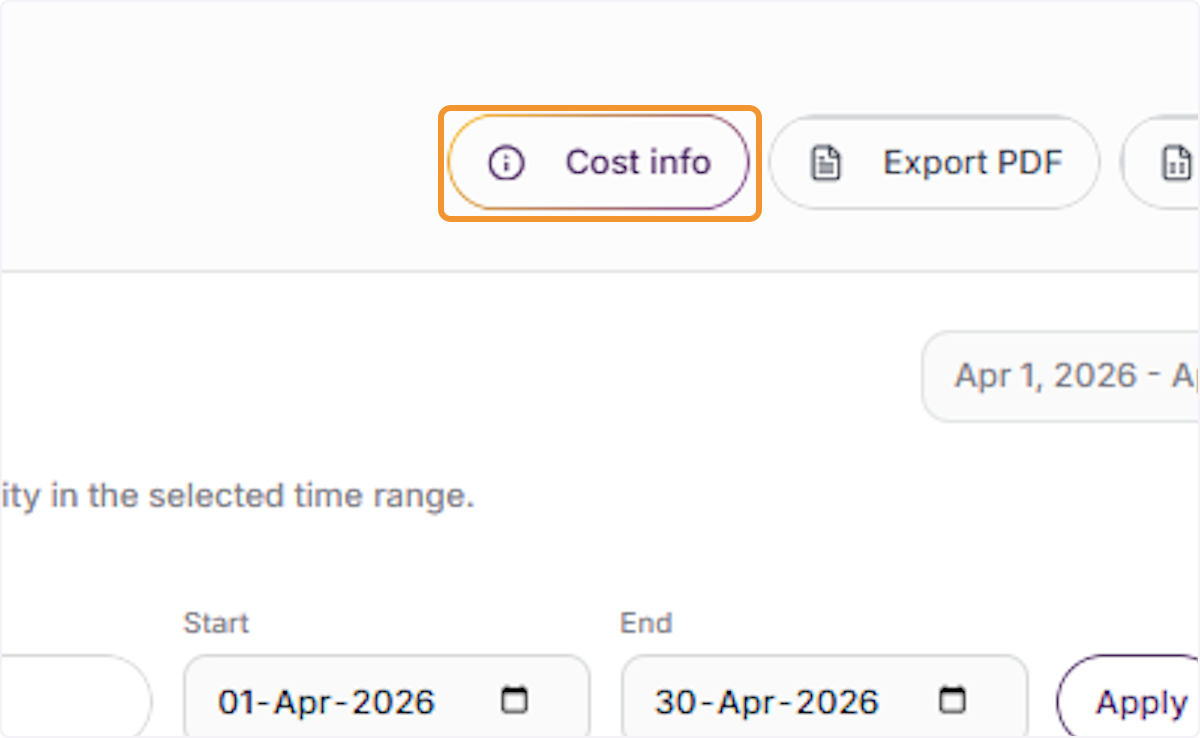
Click the Cost Info button in the top toolbar to open the pricing breakdown panel, which displays the full synced model price catalog and per-call rates used to calculate tracked costs.
Review the Pricing Model Catalog
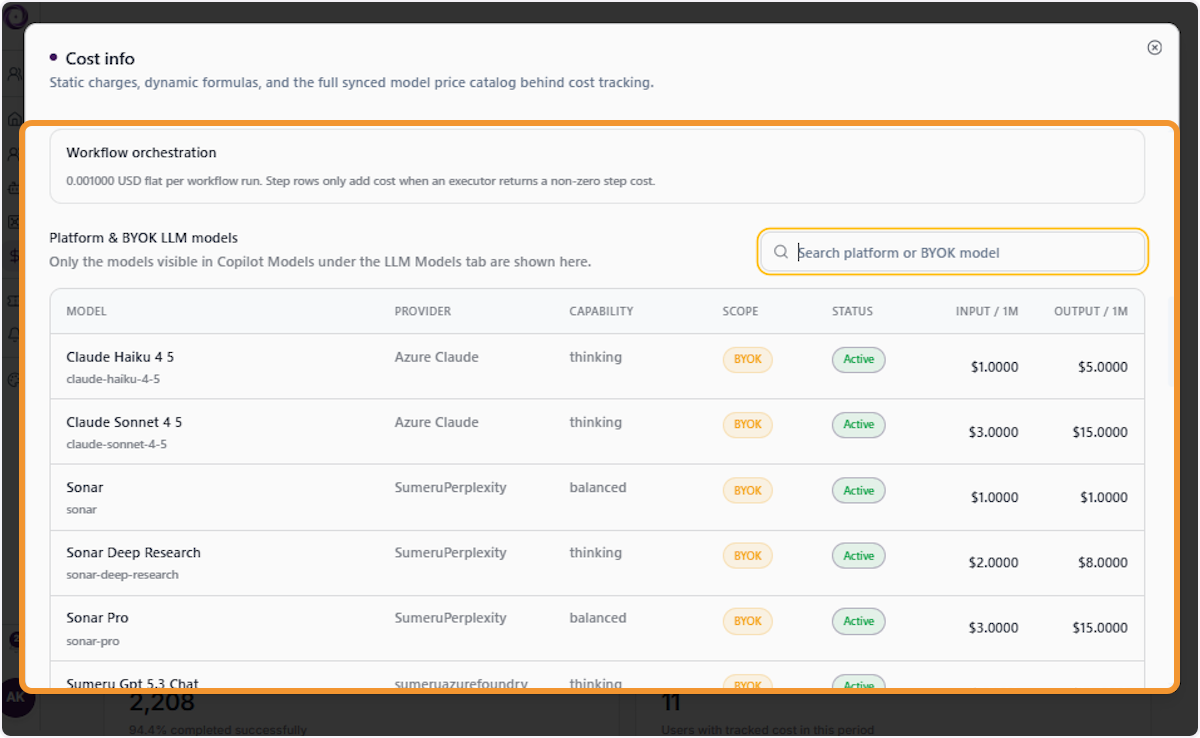
Inside the Cost Info panel, review the pricing logic and the full model catalog — including Platform & BYOK LLM models — which reflects the same synced pricing source shown in /cockpit/copilot/models.
Exporting Cost Reports
Review Per-Service Pricing Rates
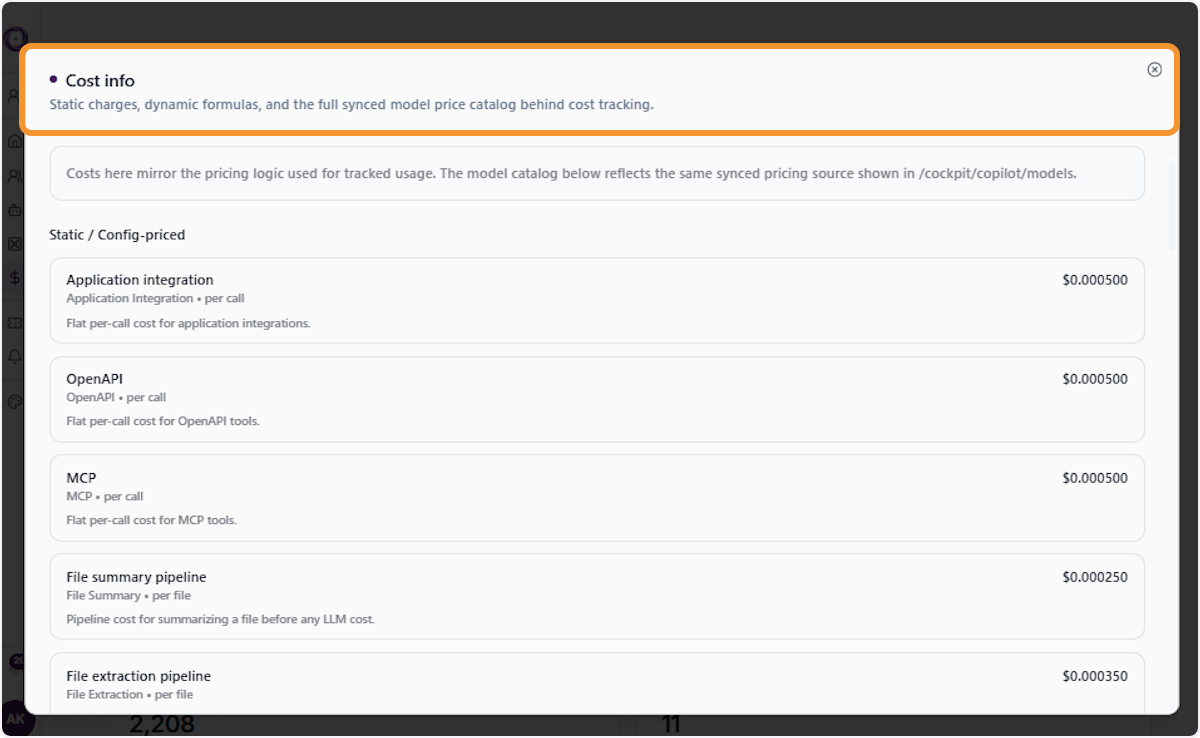
Inside the Cost Info panel, review the Static/Config-priced per-call rates for services such as Application Integration, OpenAPI, MCP, File Summary Pipeline, and File Extraction Pipeline before exporting.
Close the Cost Info Panel
Click the ✕ (Close) icon in the top-right corner of the Cost Info panel to dismiss it and return to the main Cost Tracking dashboard.
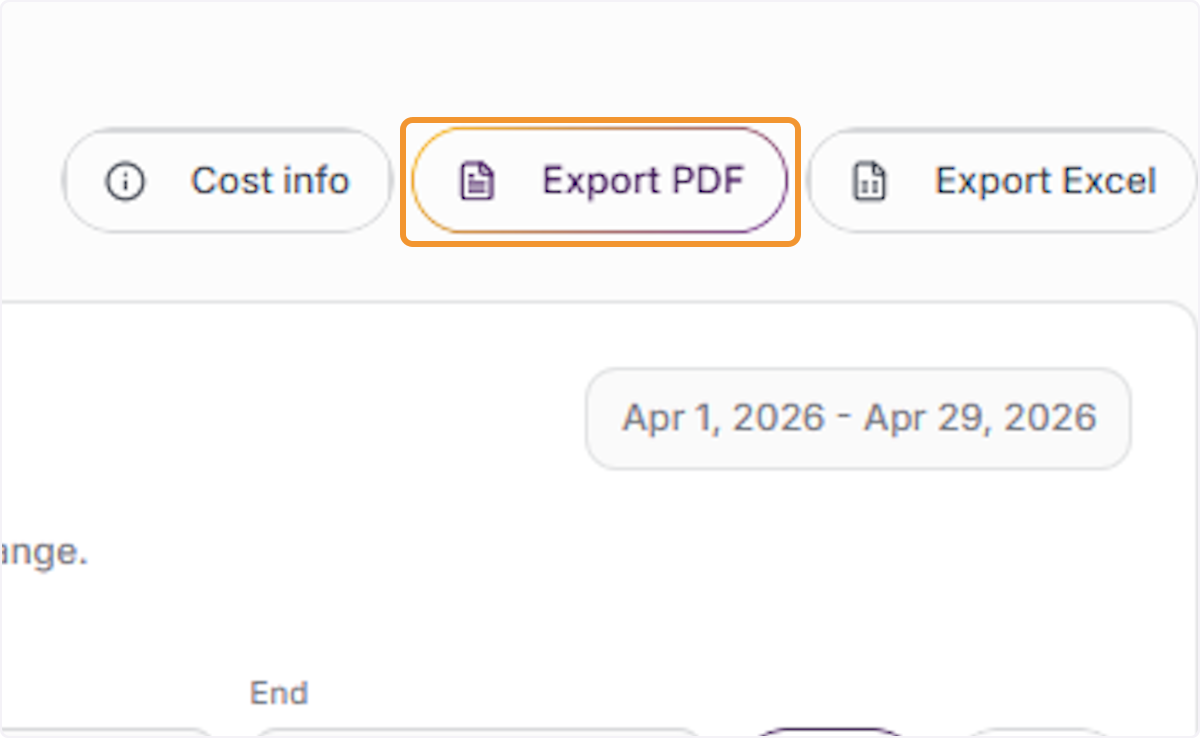
Export Report as PDF
Click the Export PDF button in the top-right toolbar to generate and download a PDF version of the current Cost Tracking report for the selected date range and active filters.
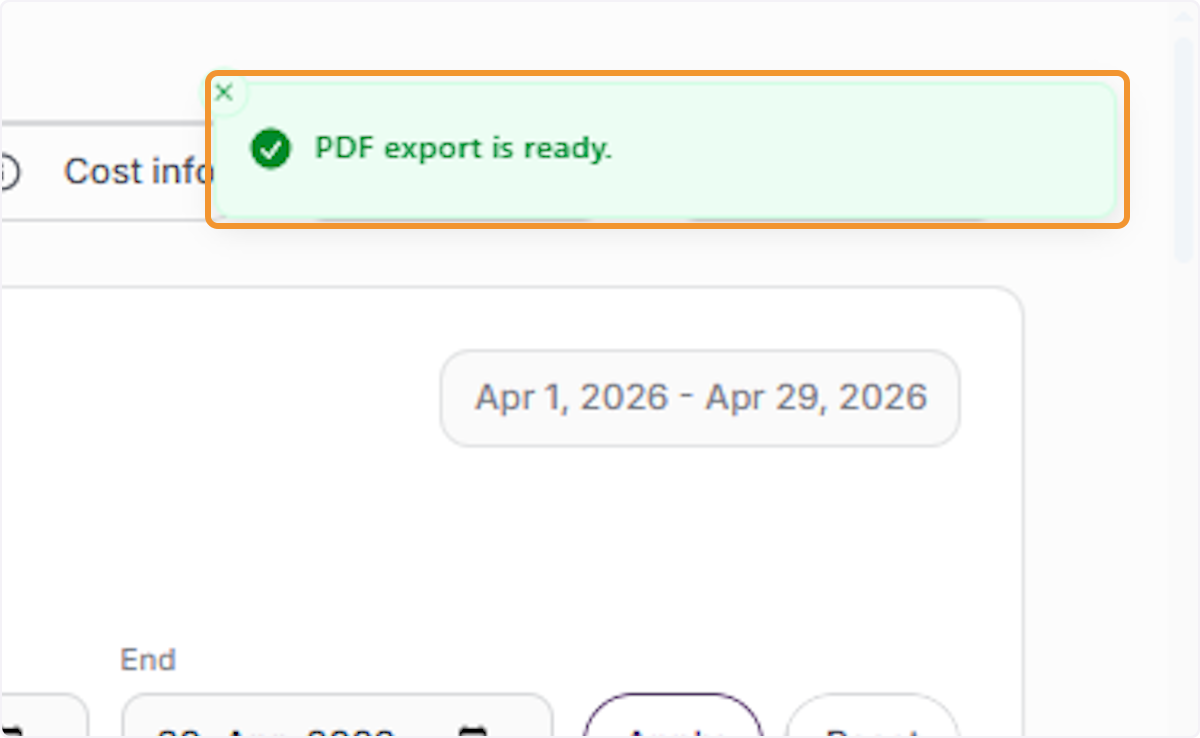
Confirm PDF Export is Ready
A green confirmation banner — “PDF export is ready” — will appear at the top of the screen, confirming the file has been successfully generated and is available to download.
Return to the Copilot Dashboard
Click the Copilot breadcrumb at the top of the page to navigate back to the main Cost Tracking view and verify all cost summary metrics are correctly displayed.
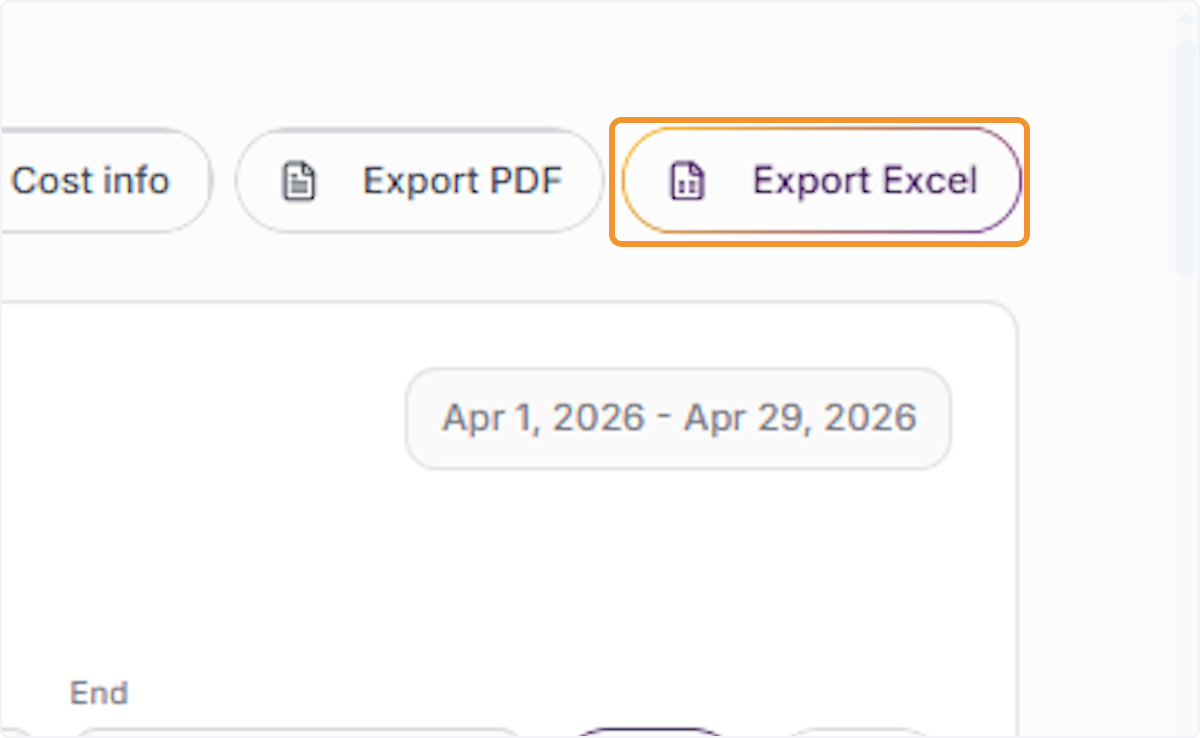
Export Report as Excel
Click the Export Excel button in the top-right toolbar to generate and download a spreadsheet version of the current Cost Tracking report, ideal for further analysis or sharing with stakeholders.
Confirm Excel Export is Ready
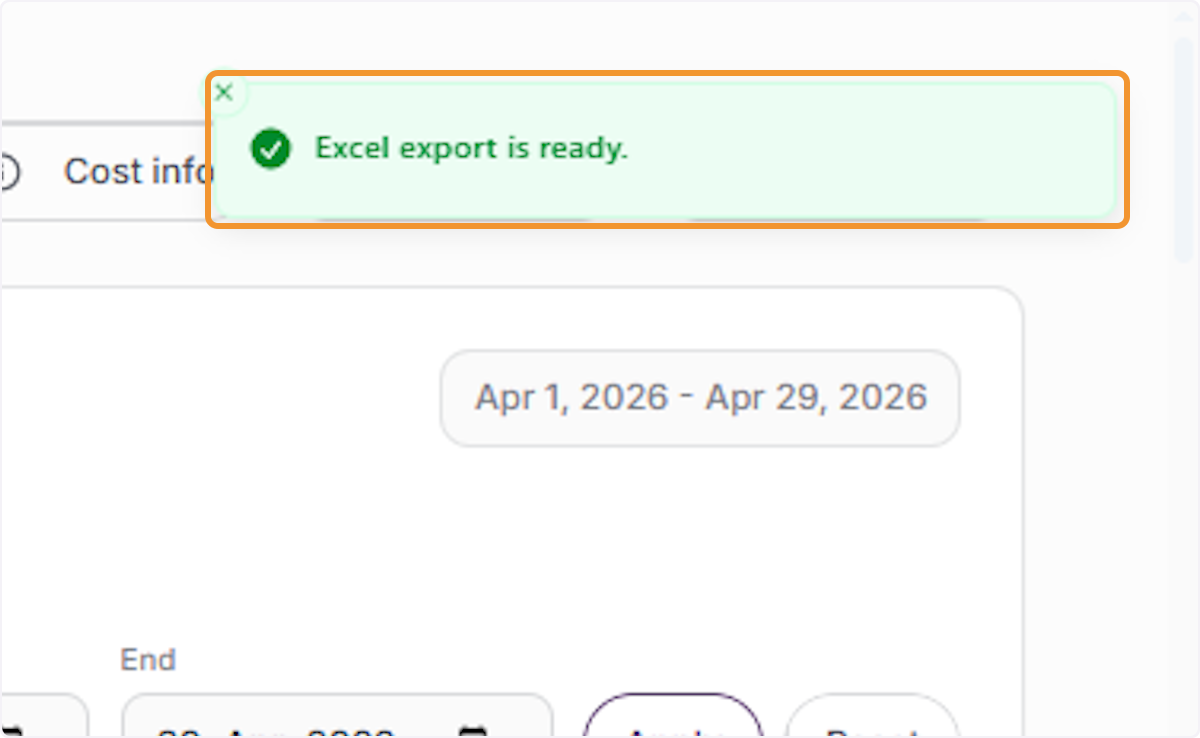
A green confirmation banner — “Excel export is ready” — will appear at the top of the screen, confirming the spreadsheet file has been successfully generated and downloaded.
Filtering Cost Data
Apply a Preset Time Filter
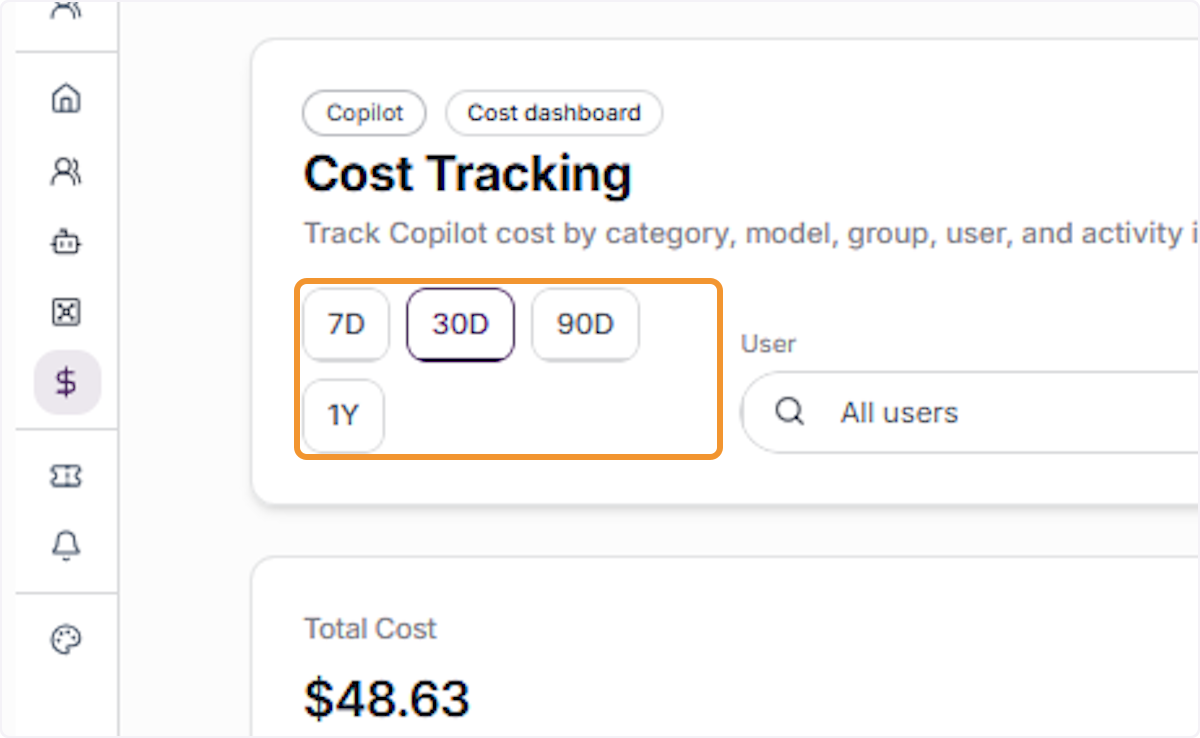
Use the time range preset buttons — 7D, 30D, 90D, or 1Y — to quickly filter the Cost Tracking dashboard and display data for a specific period without manually entering custom dates.
Filter by Specific User
Click the All Users dropdown and select a specific user to filter all cost metrics, breakdowns, and activity logs to display only that individual user’s usage and spend data.